Following landing page metrics the minute your ad goes live is necessary to scale your campaign’s performance. While we’re not suggesting you become fixated on the numbers, tracking certain KPIs is necessary to gauging your landing page’s success. By promptly measuring these metrics, you’ll gain invaluable insights into what’s working and what’s not. Is your copy strong enough? Does your design need to be more engaging? Let’s get you started by deep-diving into metrics and how to measure them with Google Analytics before you spend more time contemplating the right metrics to monitor your landing page performance.
What are landing page metrics?
Landing page metrics help determine whether your campaign is headed for success. They provide essential quantitative data, making comparing and measuring performance easy.
 Before launching a campaign, it’s essential to establish specific metrics to measure. Make sure you select the right, achievable goals. Consider the following questions before setting your campaign objectives:
-
Have you set a particular aim for your campaign?
-
Are the goals relevant to your success?
-
Are your goals measurable and time-bound?
-
Do you have a clear target audience in mind? Answering these questions will help you state real and achievable goals for your landing page.
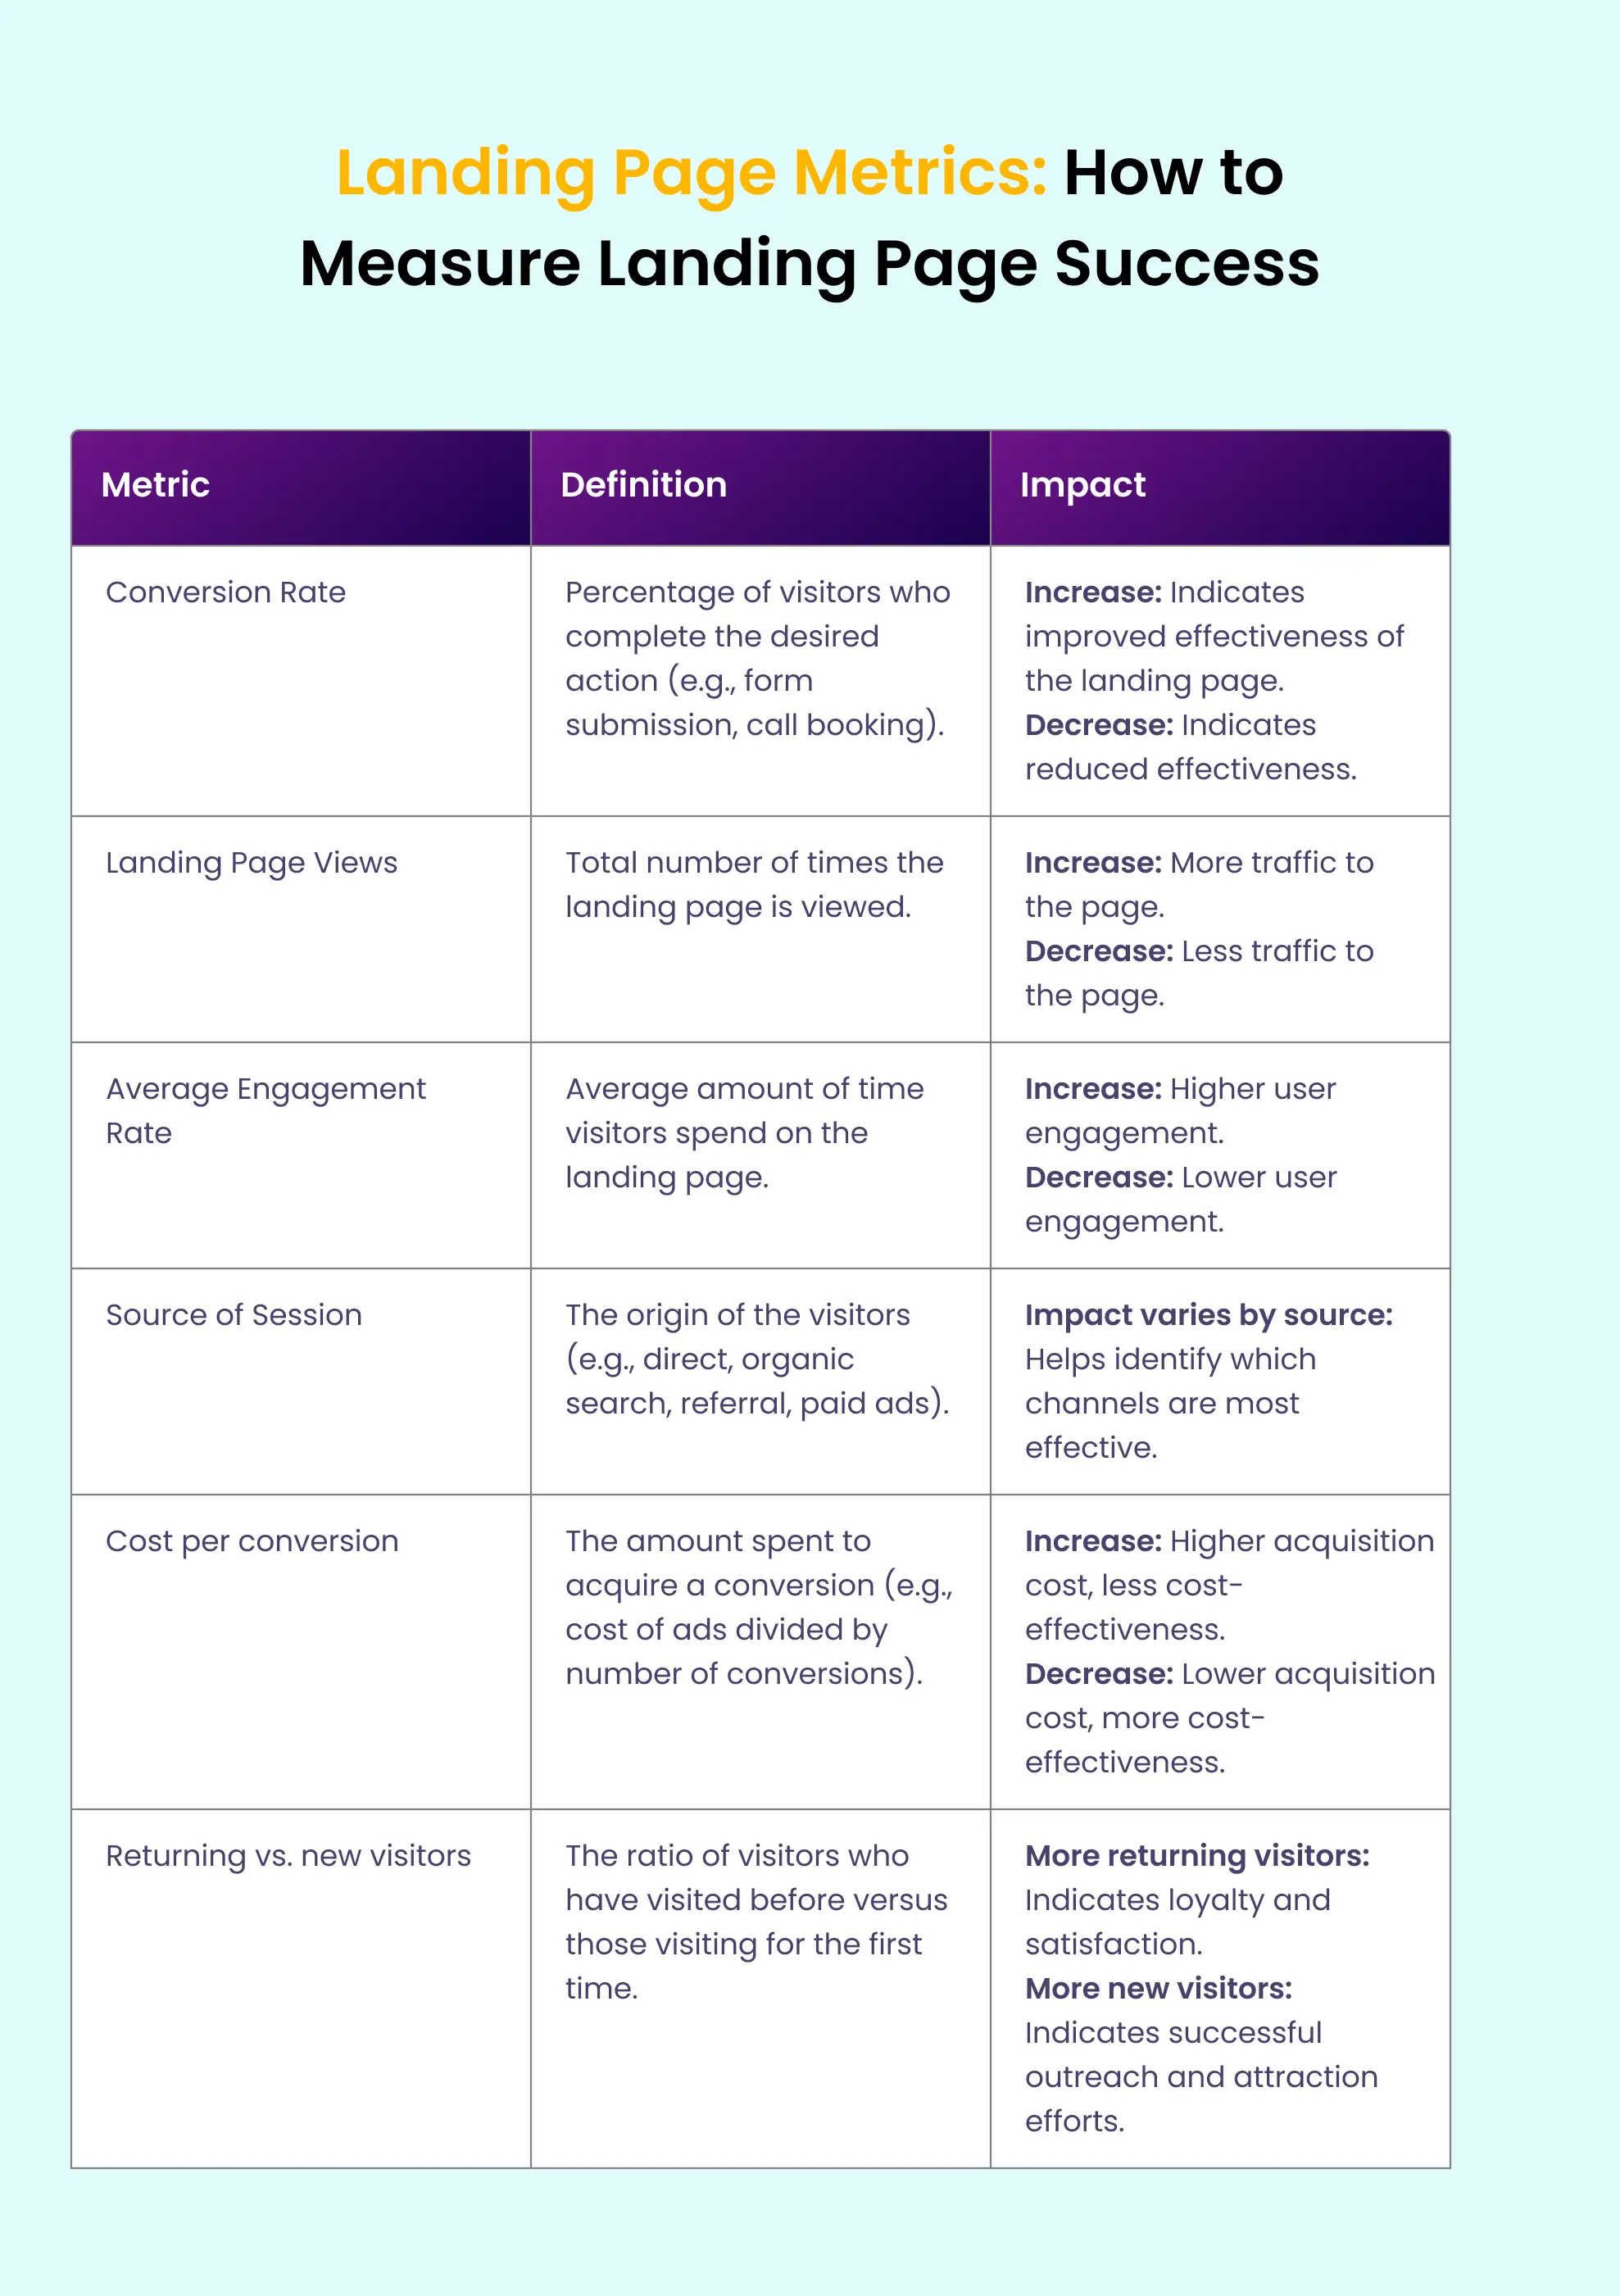
7 landing page metrics to measure for better landing page performance
Here are the essential and different landing page metrics that can help you identify your landing page’s performance.
1. Conversion Rate
Conversion rate is the percentage of how many visitors took a desired action on your landing page.
What’s the importance of landing page conversion rate?
-
It can help you identify which landing pages should have more of your budget and time.
-
It enables you to determine the audience you should serve.
-
Aids in optimizing the existing landing page.
-
It helps in scratching out why a customer came to this Page and further actions s/he takes.
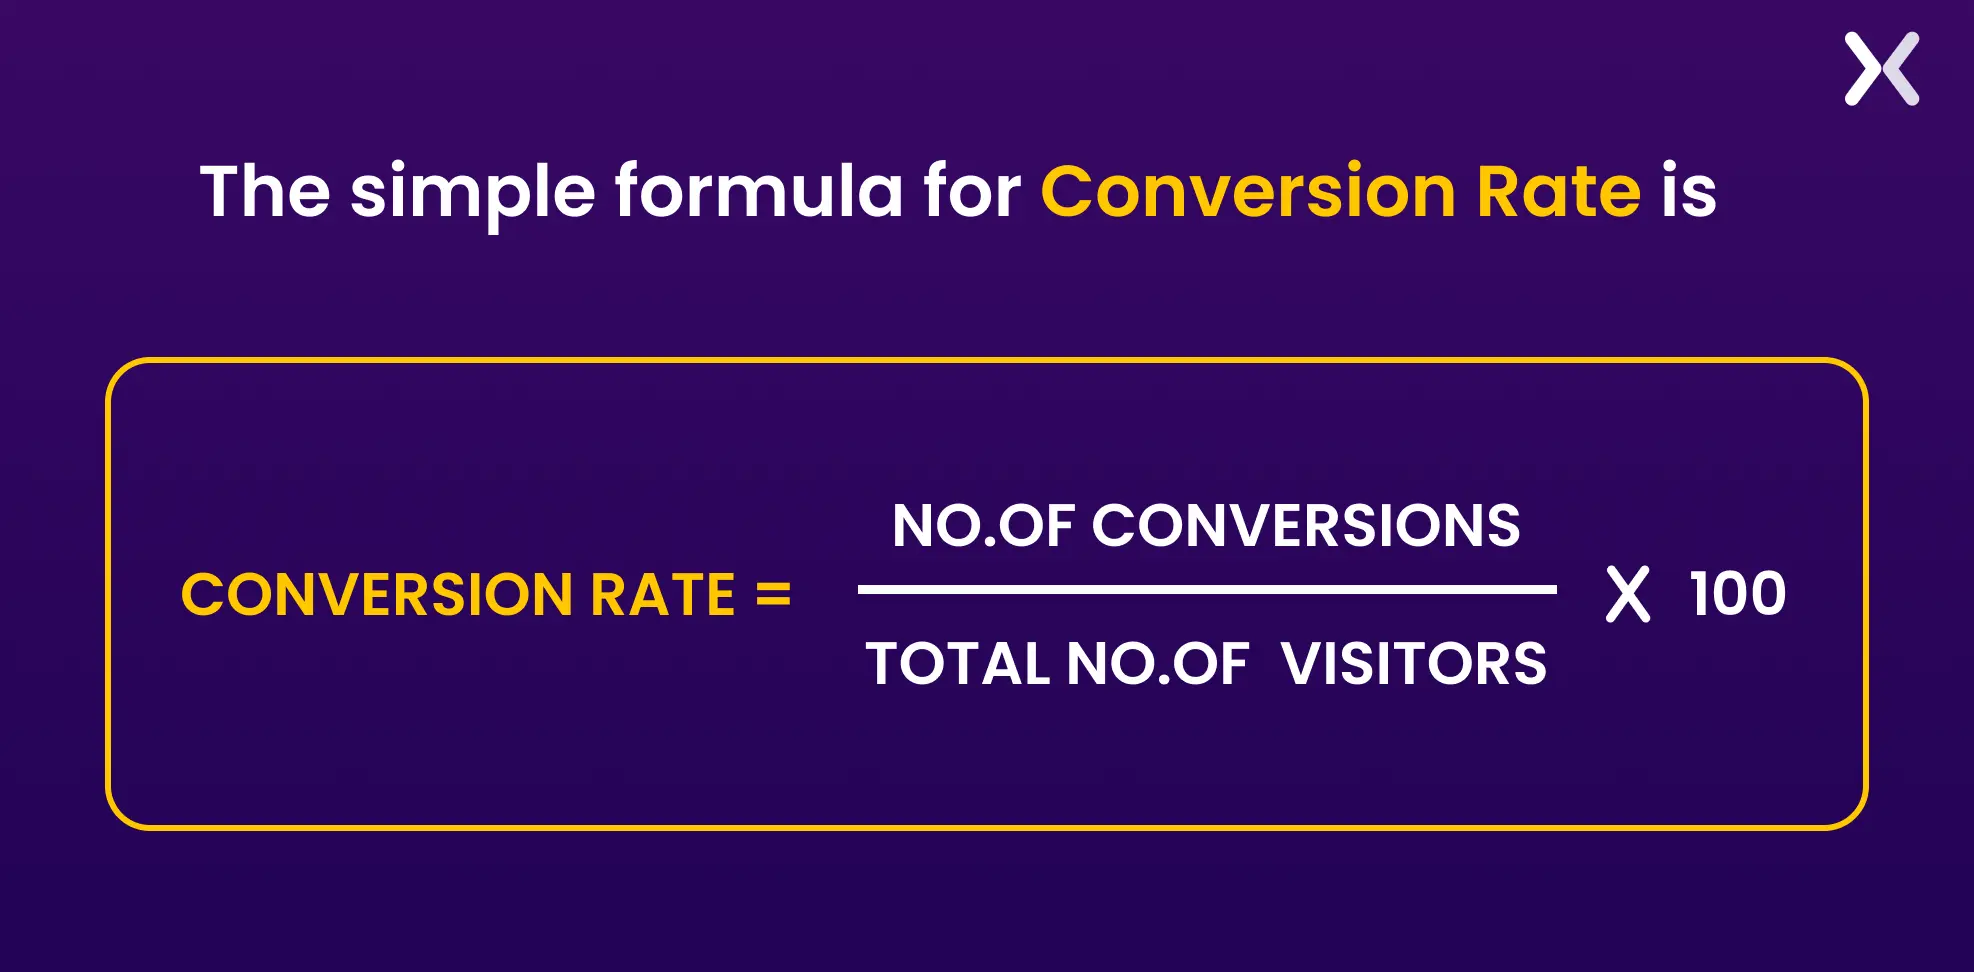
How to calculate landing page conversion rate?
Data speaks louder than words. Hence, one should know how to calculate the conversion rate to understand the landing page’s success. The simple formula for Conversion Rate is-
What’s a good conversion rate for a landing page?
According to research:
-
Average landing page conversion rate: 2.35%
-
Top 25% of sites: Conversion rate of 5.31% and above
-
Top 10% of sites: Conversion rate of 11.45% and above The conversion rate of every industry varies. Hence, there’s no ballpark number for you to target. However, identify your industry’s average conversion rate. For starters, you can use the above metrics shared, but if you’re ambitious, we suggest using the method below. Research the top 25 websites of your niche and what they do to maintain a reasonable conversion rate. Make sure that you hit that average conversion rate. It is the best way to benchmark landing page conversions.
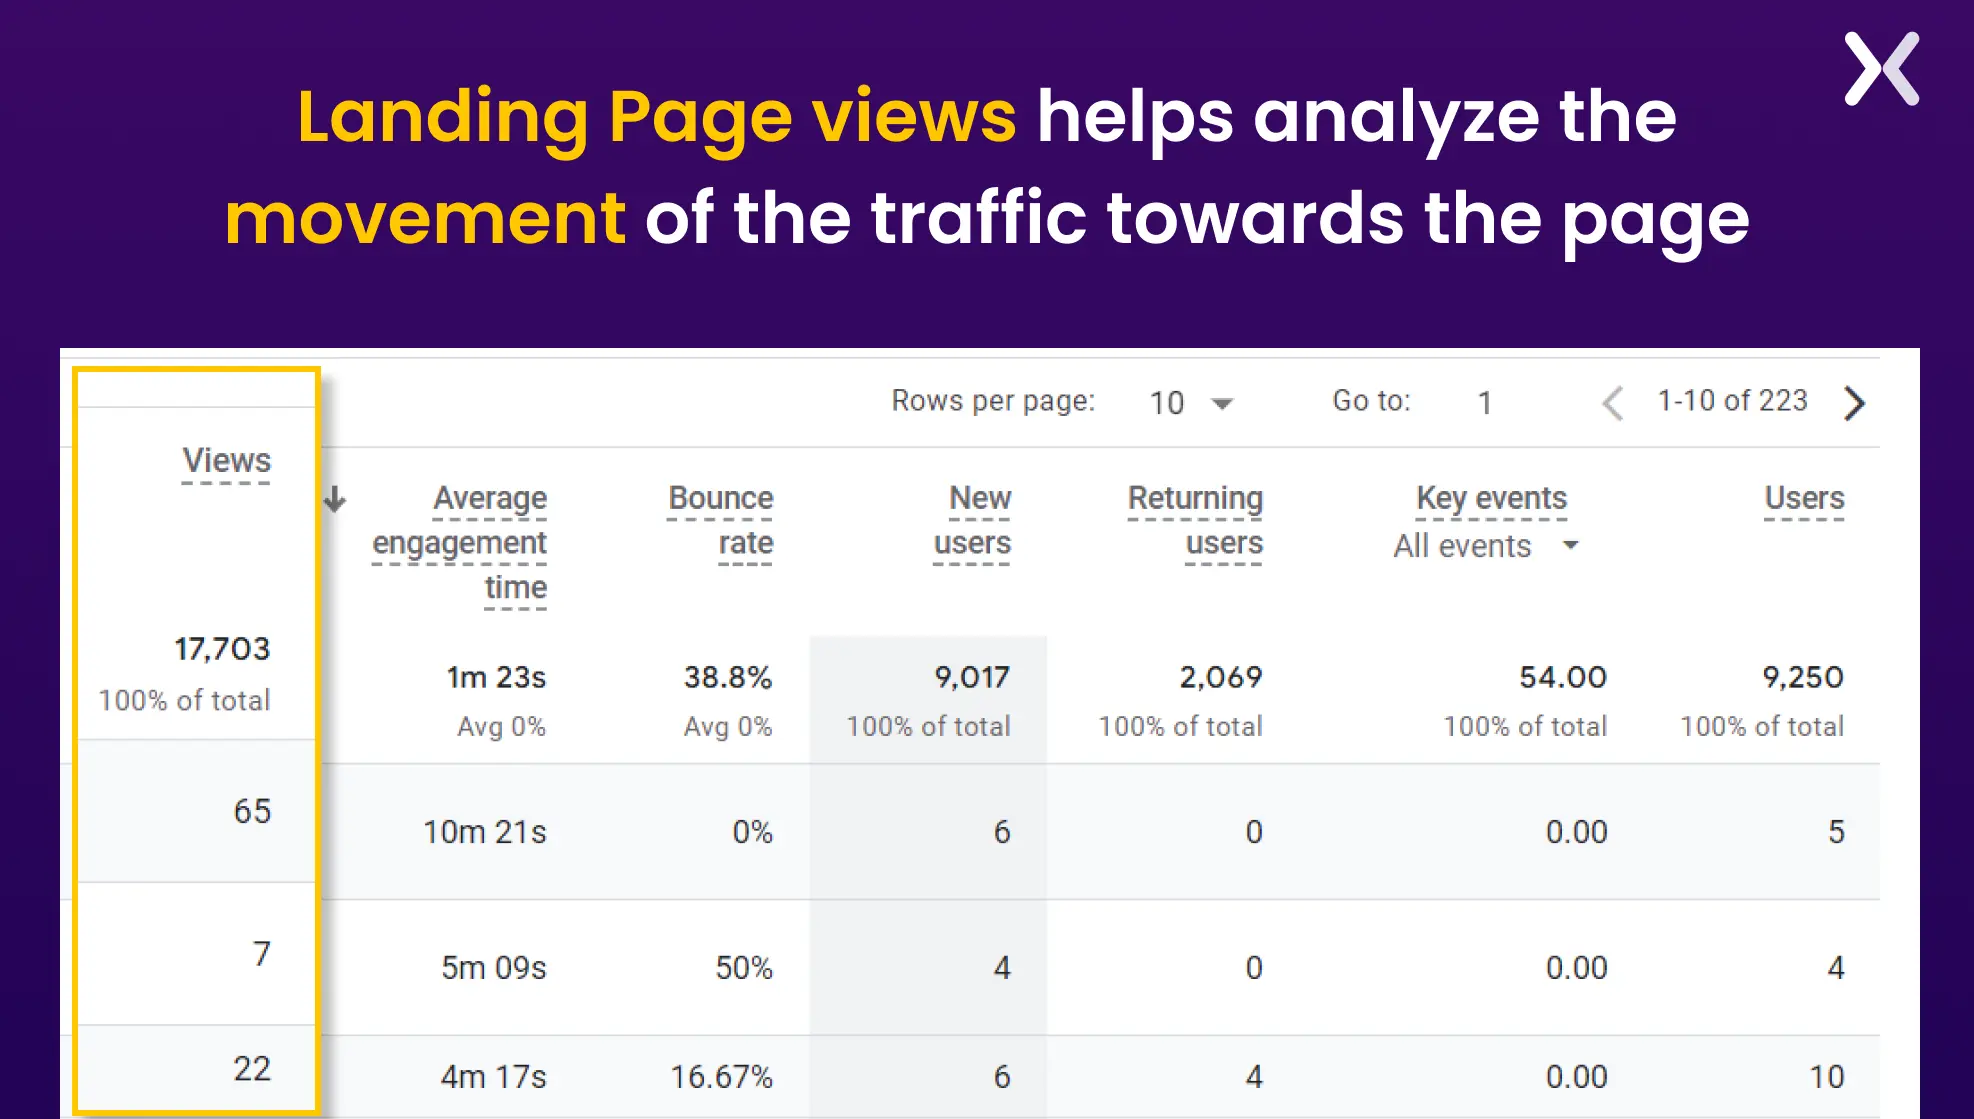
2. Landing page views
“One View is all it takes.” The first view of the visitor helps them decide whether to buy. Hence, views are as important as any other metric.
What’s the importance of landing page views?
-
You can identify the source from which maximum landing page views get achieved.
-
If the conversion rate is low but the viewer rate is high. It can help optimize the landing page performance.
-
You can identify if any special occasion has led to more views/searches.
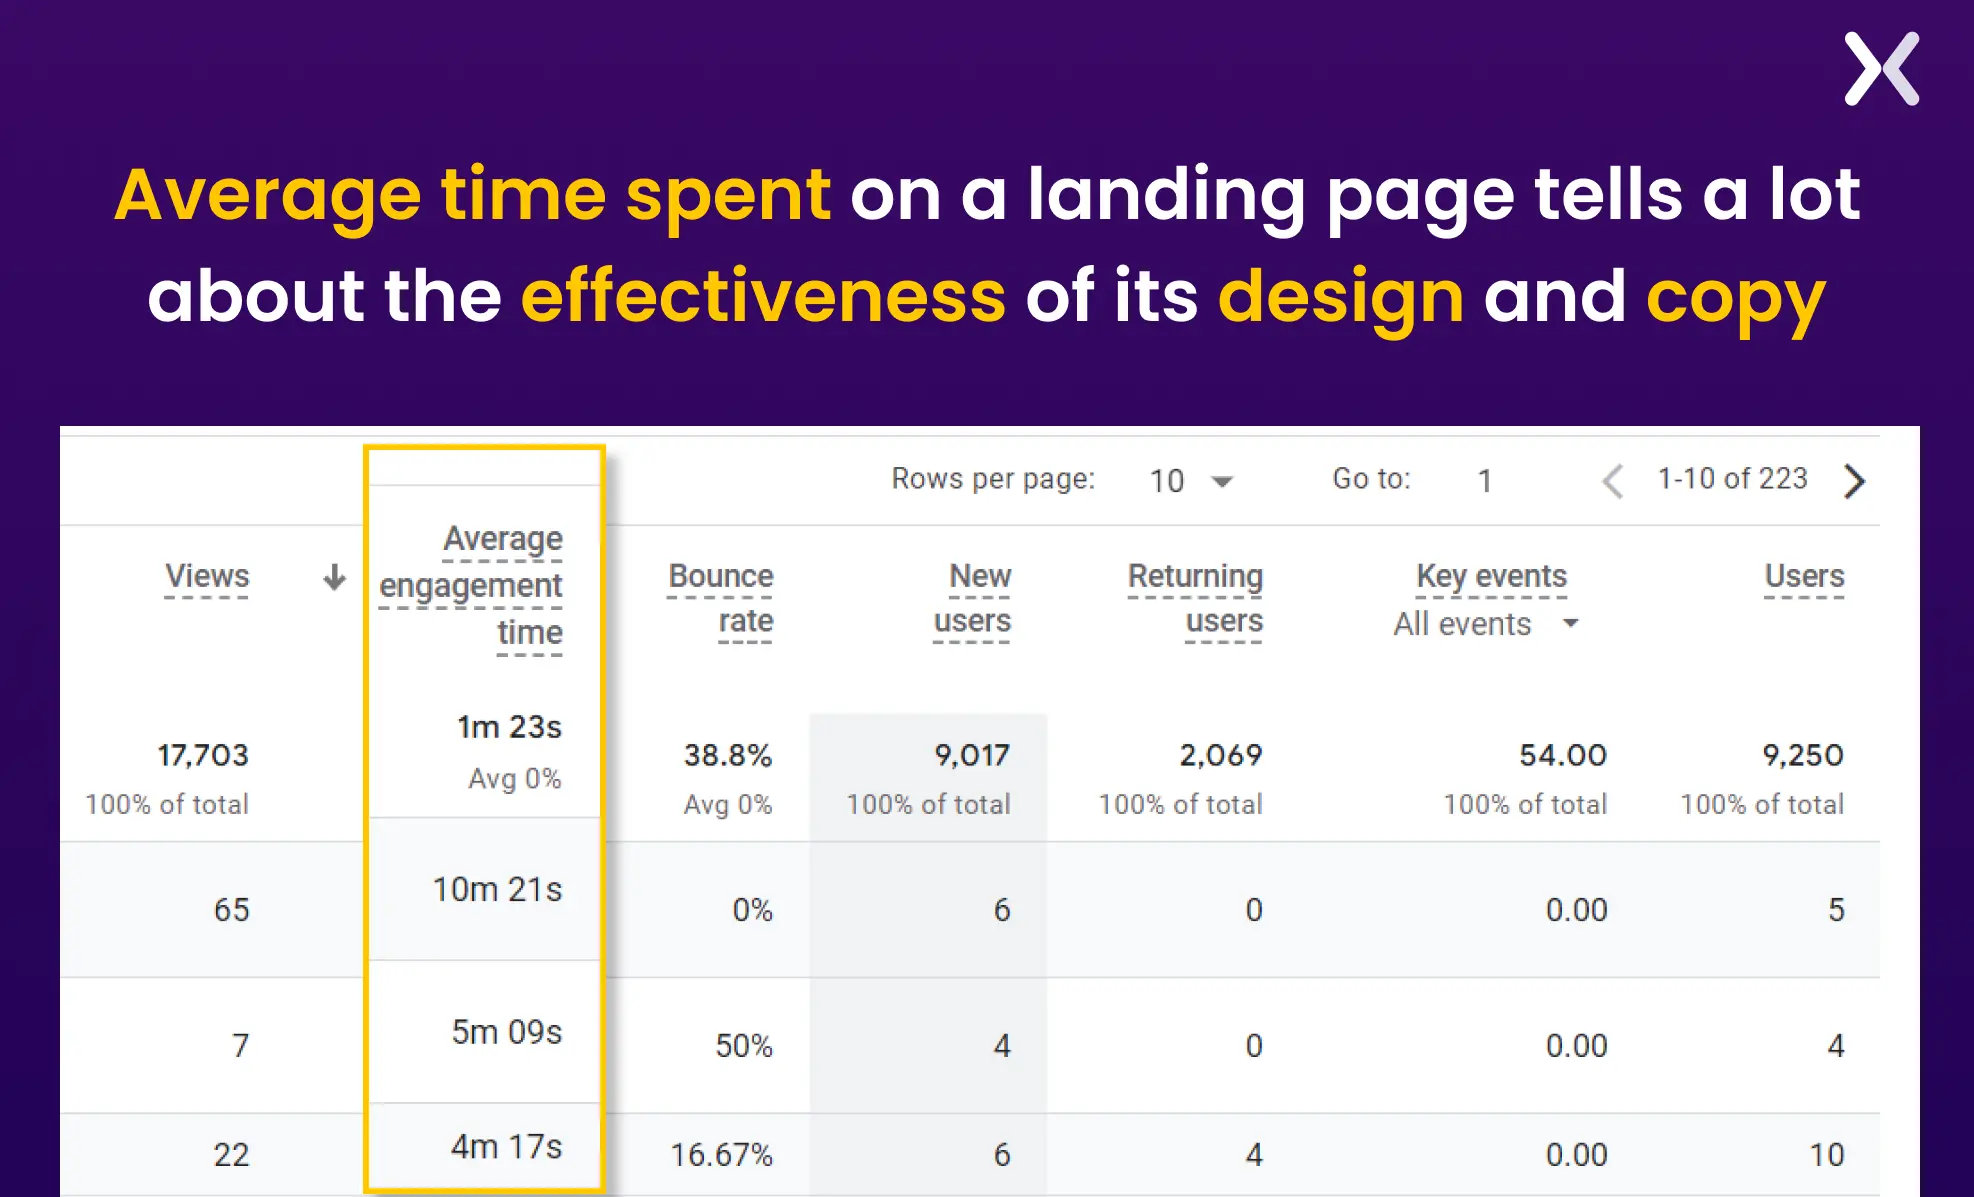
3. Average engagement time
In Google Analytics 4 (GA4), the metric formerly known as average time spent on the page has been updated to average engagement time, showing how long visitors stay on your landing page.
What’s the importance of average time spent on the page?
-
It helps understand on which Page a consumer is spending more time.
-
Let’s analyze if a specific design or deal has persuaded them to spend more time on the Page.
Kindly note the average engagement time is not directly related to whether a specific landing page can lead to a successful campaign. However, it can help you understand which page works better for you.
4. Source of the Session
Understanding the total number of viewers on your page is not sufficient. It’s also essential to understand the Source from which visitors visit your landing page. The session’s source is a pathway from which visitors can visit your landing page. The Source can be social media, affiliate marketing, Google, paid ads, etc.
Why is it important to understand the source of the session?
-
Helps identify the Source from where most visitors are coming to the page.
-
Makes it easier to analyze if you should do more paid ads for a specific platform.
-
Guides towards focusing on more conversion-driven promotional channels.
5. Cost per conversion
Once your landing page is up and matched the budget, you must make sure you’re not spending too much to get the minimum conversion rate. Hence, it’s essential to calculate the Cost spent on every conversation rate.
How do you identify the cost per conversion?
To Calculate the Cost Per Conversion, divide the total price you’re spending to generate the traffic by the number of landing page conversions.
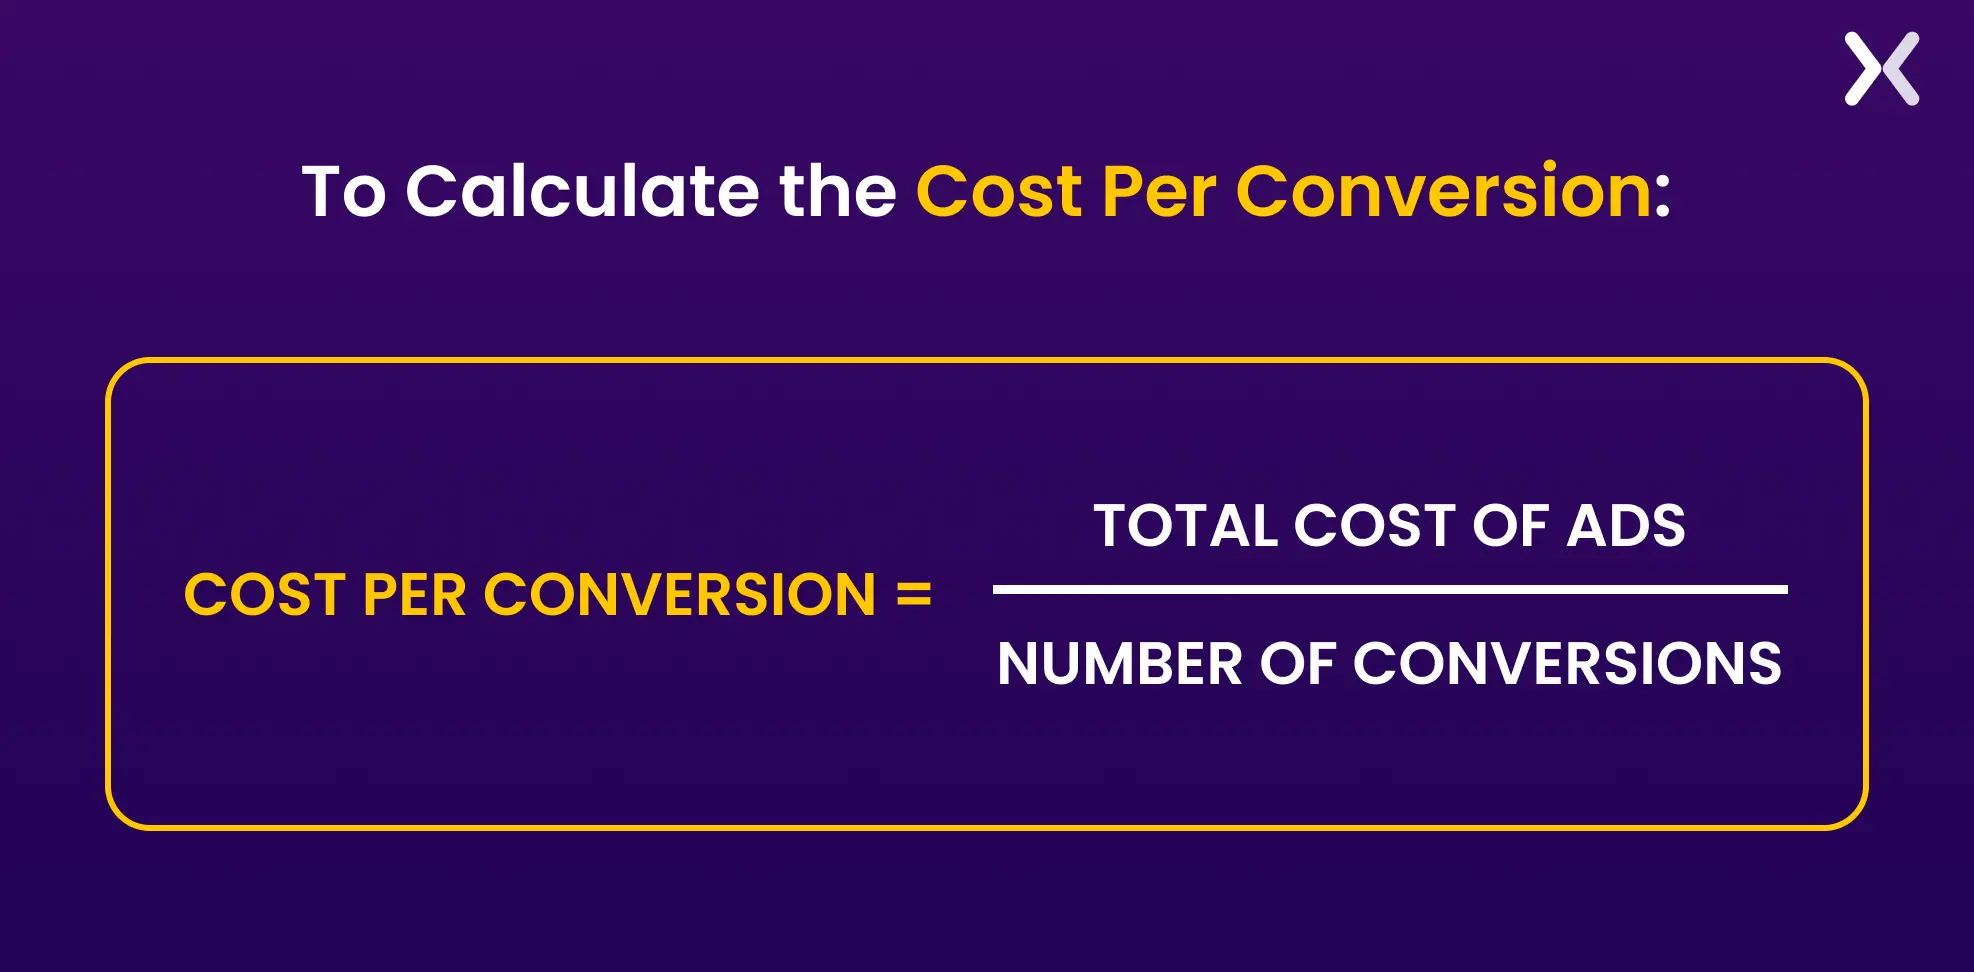 For example, if you spend $1000 on an ad campaign and you gain 100 new leads from this campaign, your conversion will be calculated as:
$1000 / 100 = $10 Your cost per conversion, in this case, will be $10.
6. Return vs. New visitors
While this is not a significant factor in identifying the landing page’s success, these metrics help in the long-term analysis. Return vs. New Visitors compares the number of visitors revisiting the landing page to the number of visitors coming for the first time.
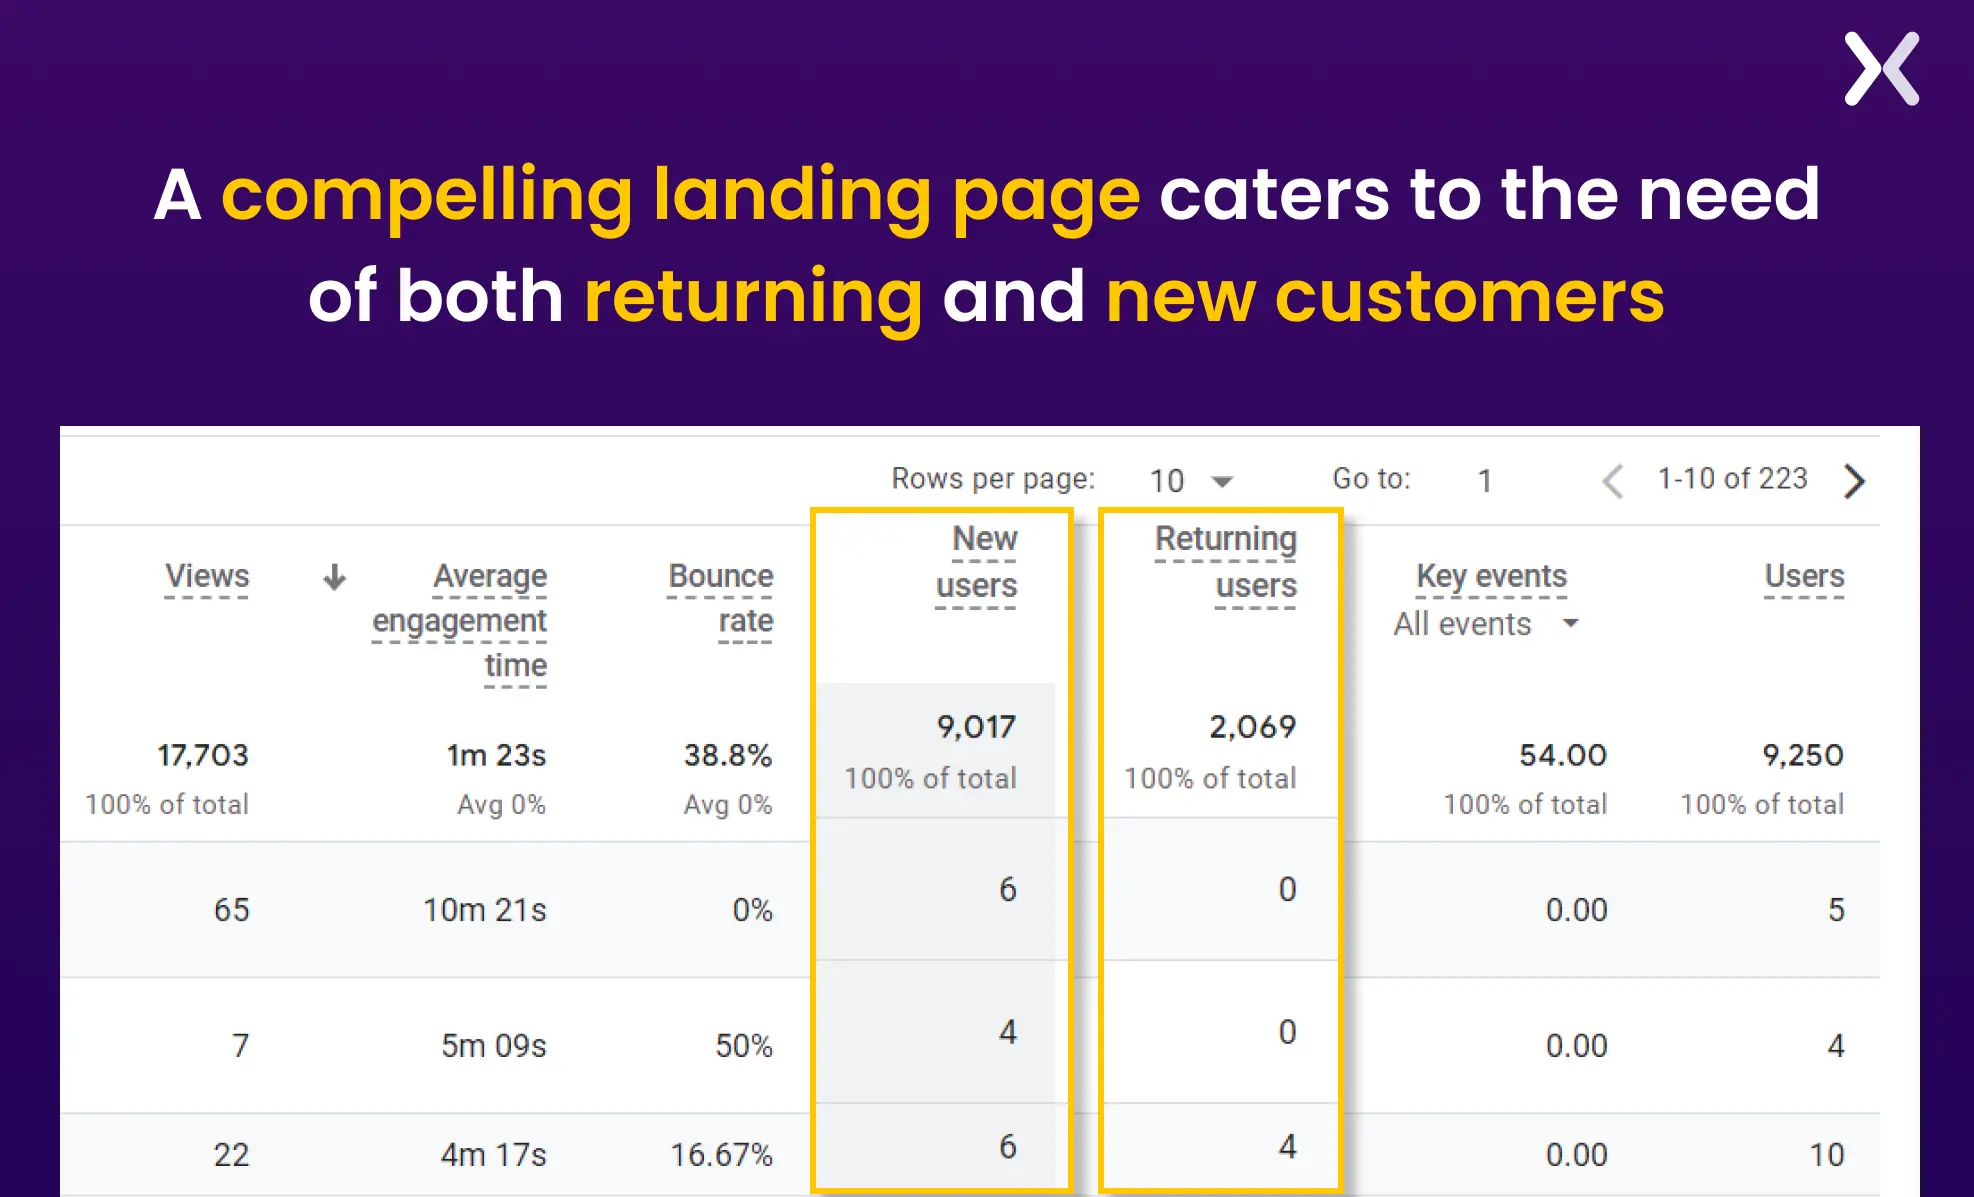 This metric helps target new visitors to come again and return customers to keep shopping. If the bounce rate of return customers is higher than that of new visitors, identify the cause behind their not purchasing again. If the rate of new visitors is high, offer them special offers to increase the return rate.
7. Bounce Rate
The bounce rate is the percentage of people who leave the website or landing page after visiting the first page. Making sure the landing page’s bounce rate doesn’t increase is essential. A higher bounce rate indicates that the viewer is unconvinced and doesn’t find the products/services attractive.
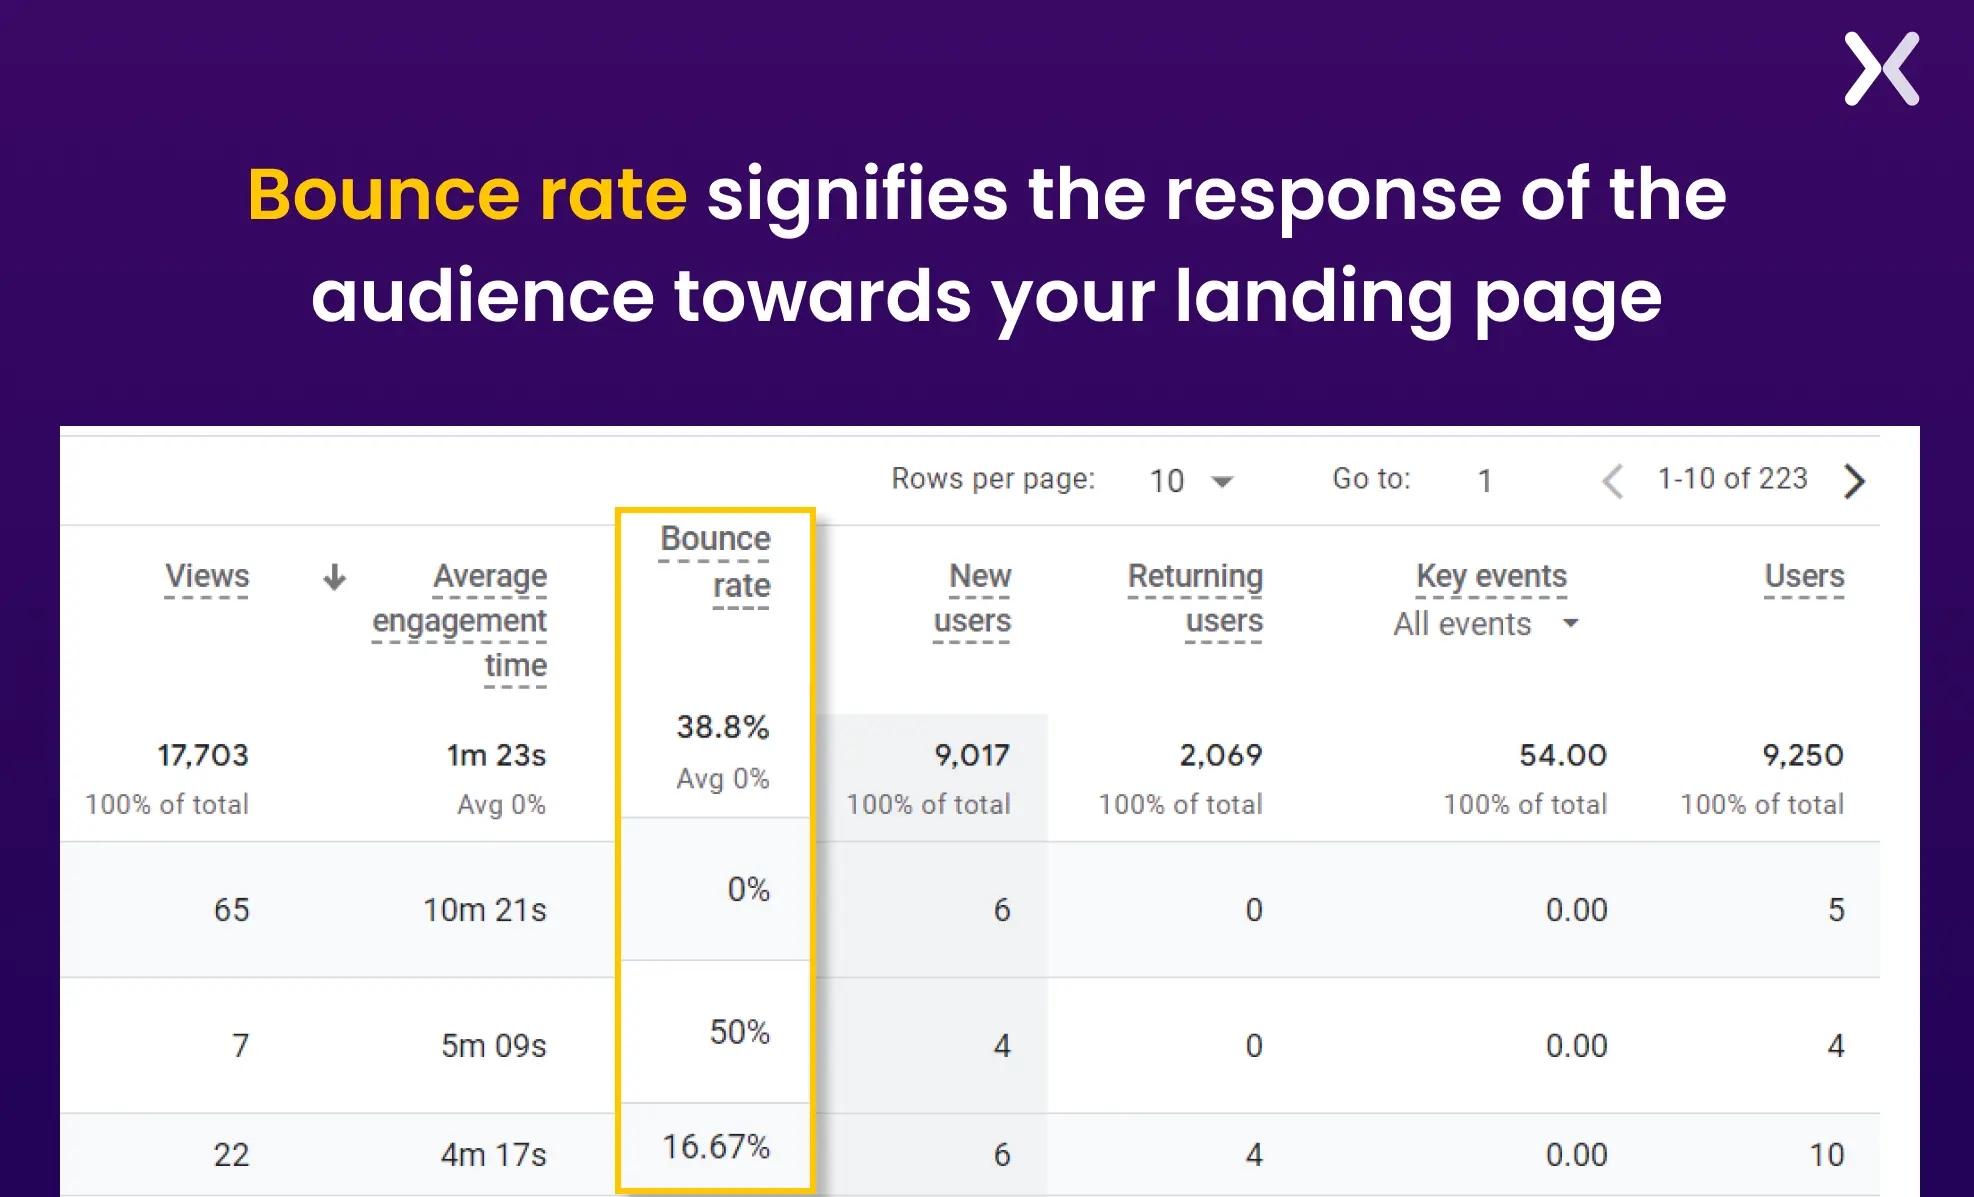 Measuring bounce rate is vital as it reveals why visitors might immediately leave your landing page, allowing you to make necessary improvements. It also indicates how strong your offer is and helps optimize your landing page for better user engagement and conversion rates.
How to use Google Analytics 4 (GA4) to measure your landing page metrics?
After covering important landing page metrics, the next step is to master their accurate measurement. Google Analytics is a dedicated tool that easily captures all metrics in one easy-to-find report.
Let’s walk through the steps to create a landing page analytics report that includes all the metrics mentioned earlier.
Step 0: setting up events
The way to calculate landing page conversions is to start by understanding what an ‘Event’ in GA4 is.
Event in GA4
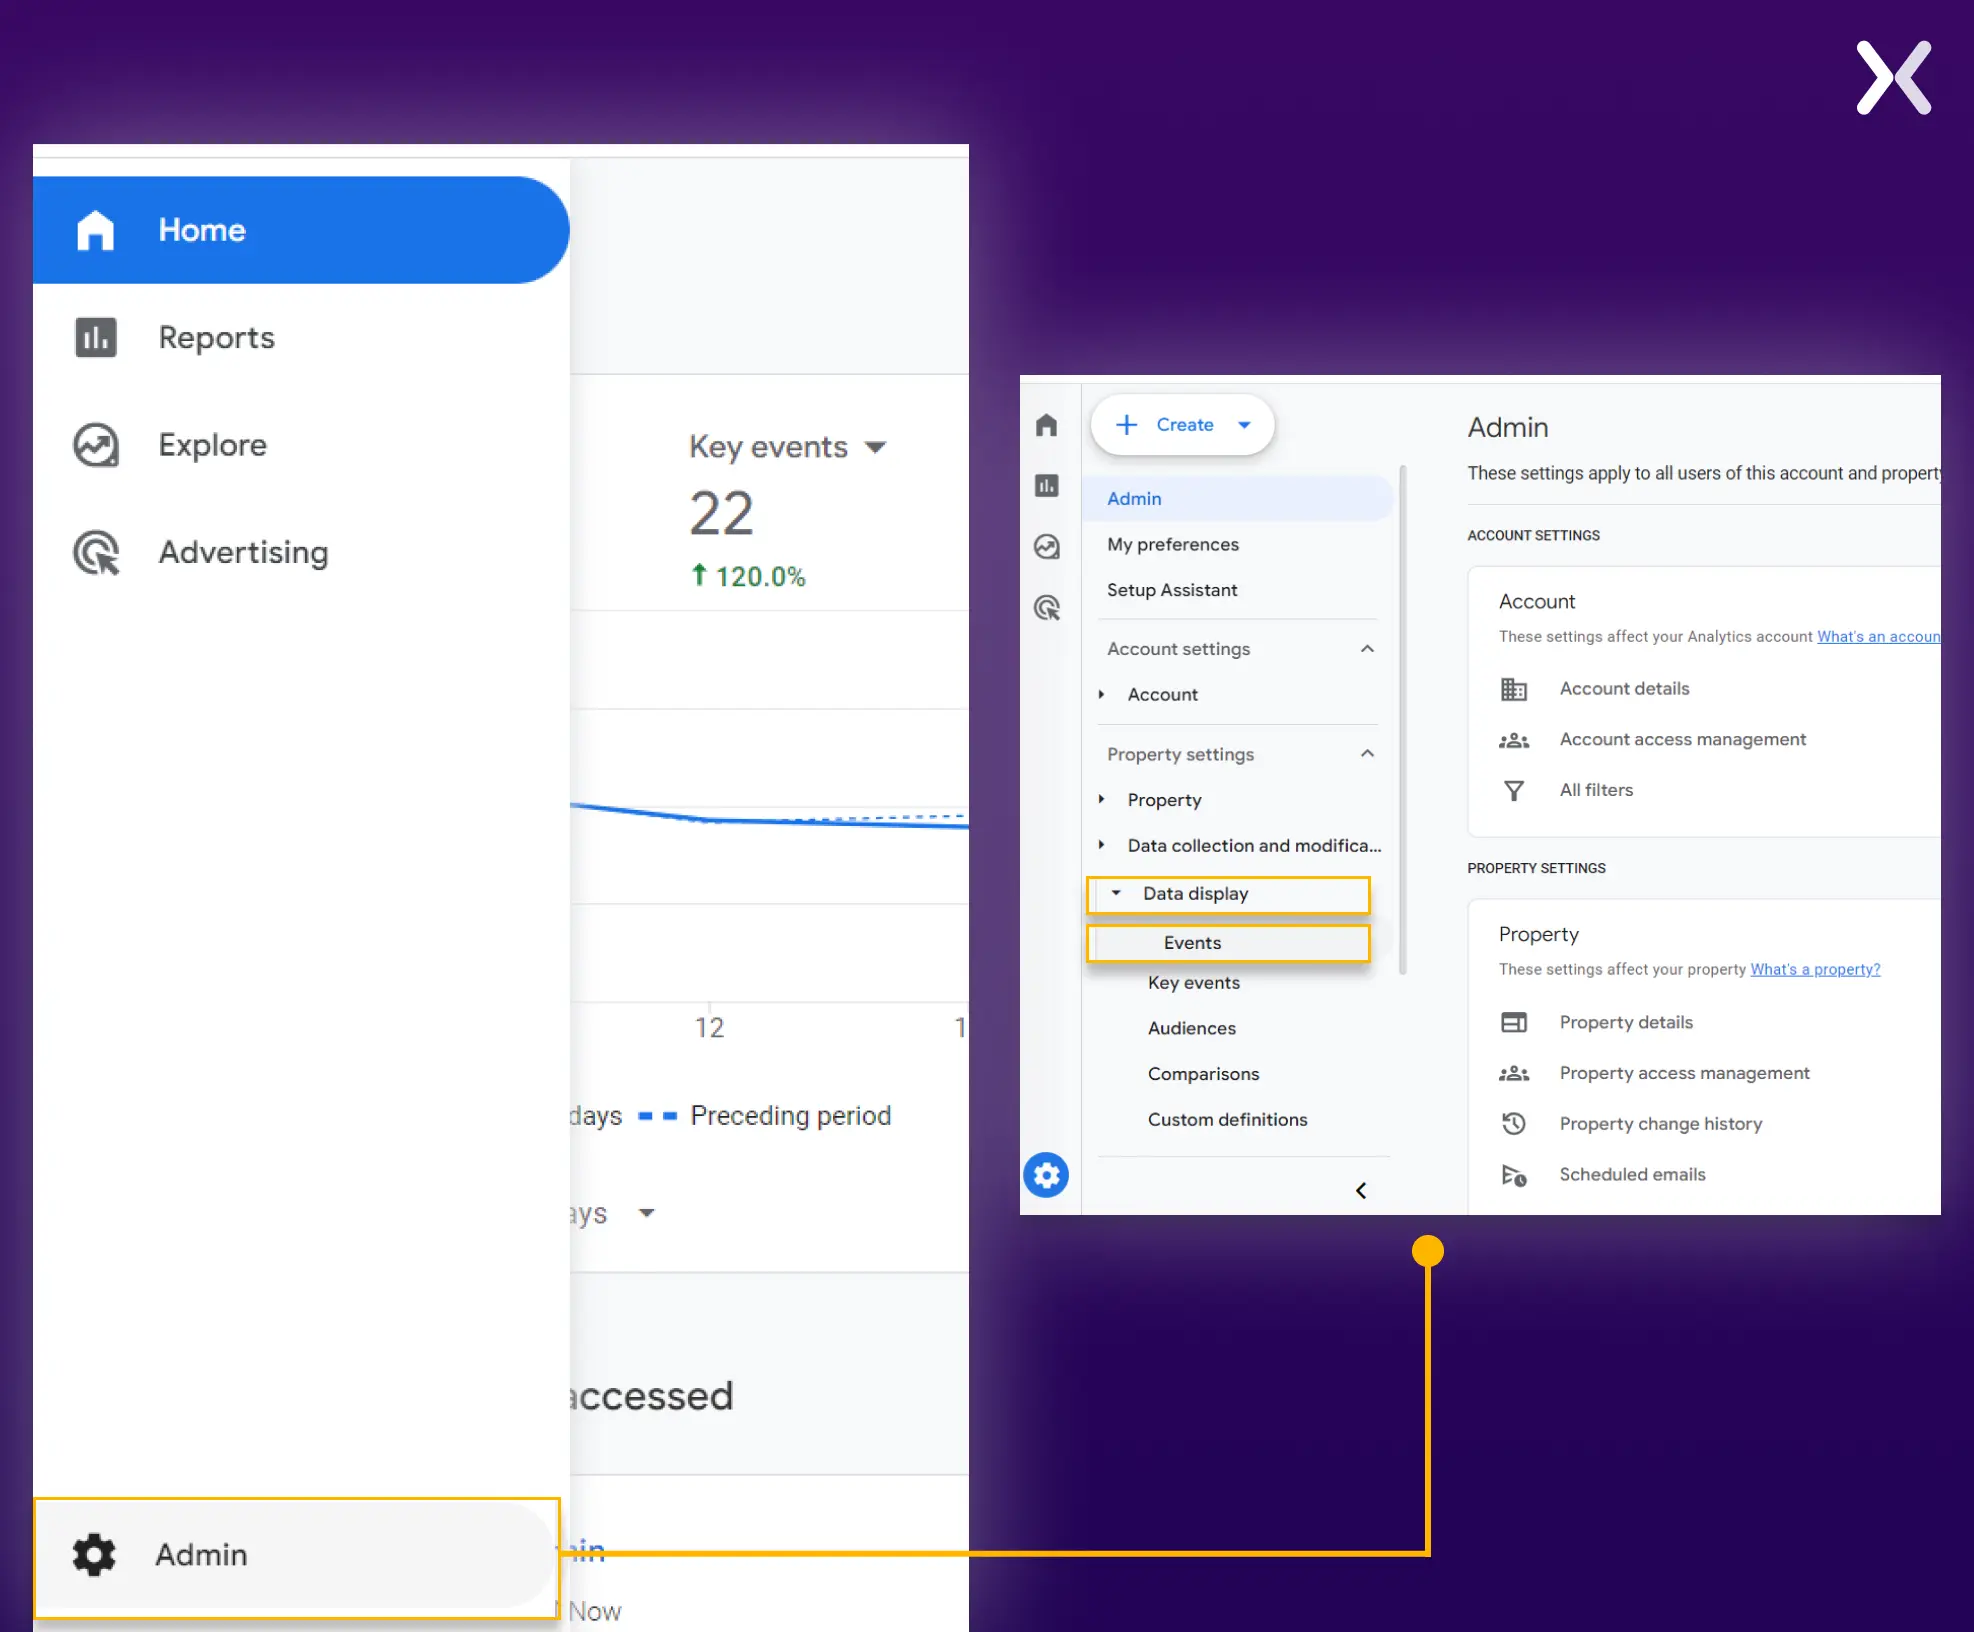
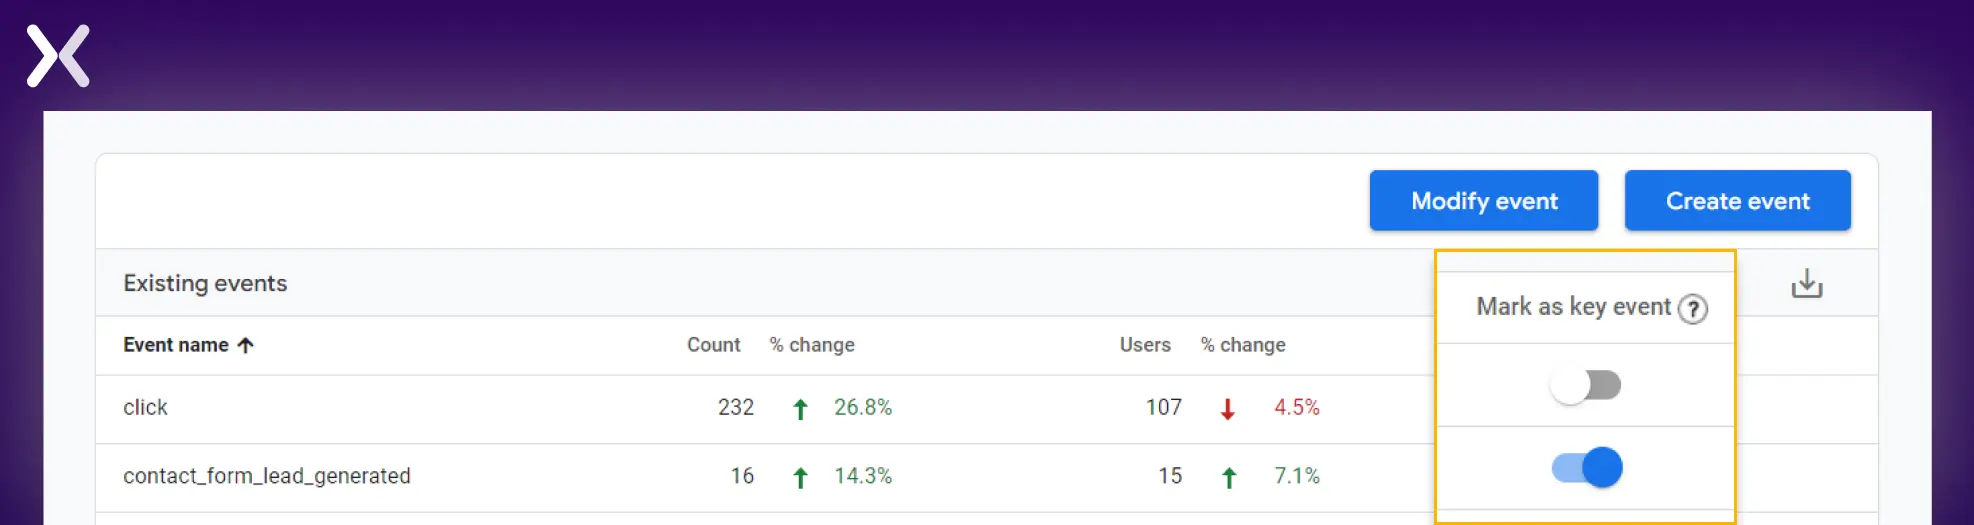
An “Event” refers to a specific user interaction or activity on your website, app, or landing page that is necessary for tracking and analyzing user behavior. Key events can include actions like page views, button clicks, form submissions, video plays, or any other significant interaction to understand how users engage with your content. For example, scrolling can be a necessary event for your landing page, as it shows that visitors are interested in learning more about the products or services. These events can be flagged and are called ‘Key Events,’ they can be related to conversion activities like form filling, booking a demo, making a purchase, etc. You can set the events directly on GA4 or with the help of Google Tag Manager (GTM). You can create new events in GA4 by going to ‘Admin’ and then ‘Data Display.’ There. You will find the events section, which you can update accordingly.
 Once you have set up your events, you need to toggle the ‘mark as key event’ option to declare the event a conversion.
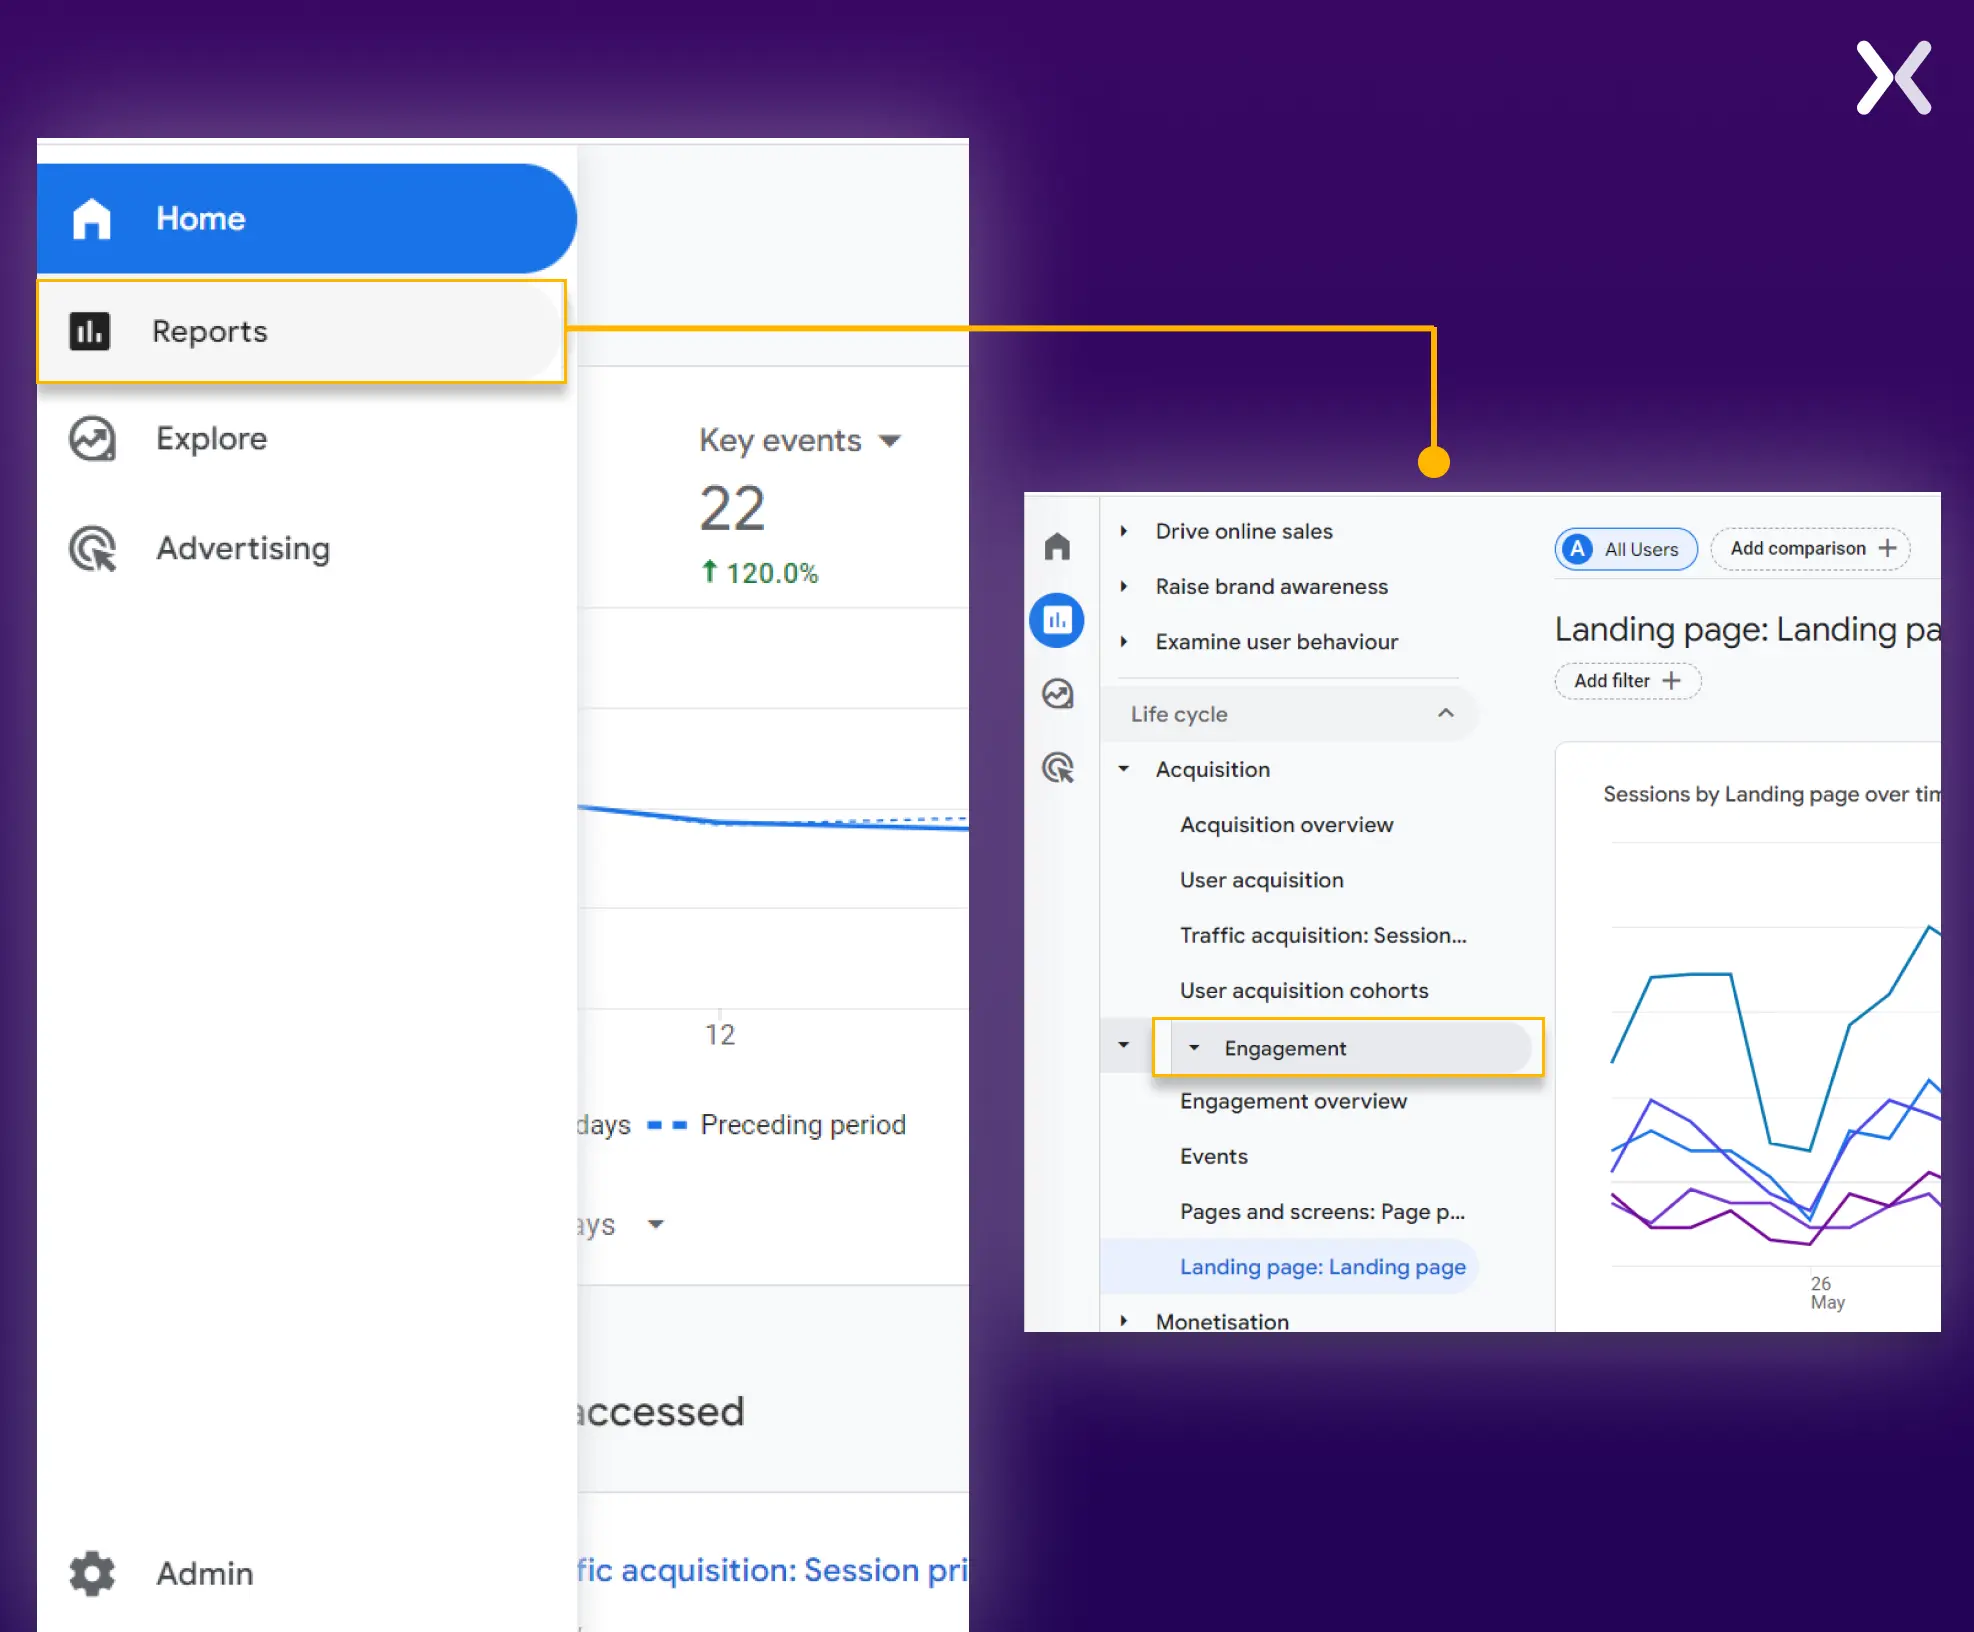
Step 1: creating landing page Analytics report
Go to the reports section. From the report, go to engagement and then the landing page section. Home»Reports»Engagement»Landing Page
Step 2: going to customizations
Now. We need to customize the landing page analytics report. To do this, click the pencil icon at the top-right corner of the screen. You can pick the metrics option from here and add the metrics we need.
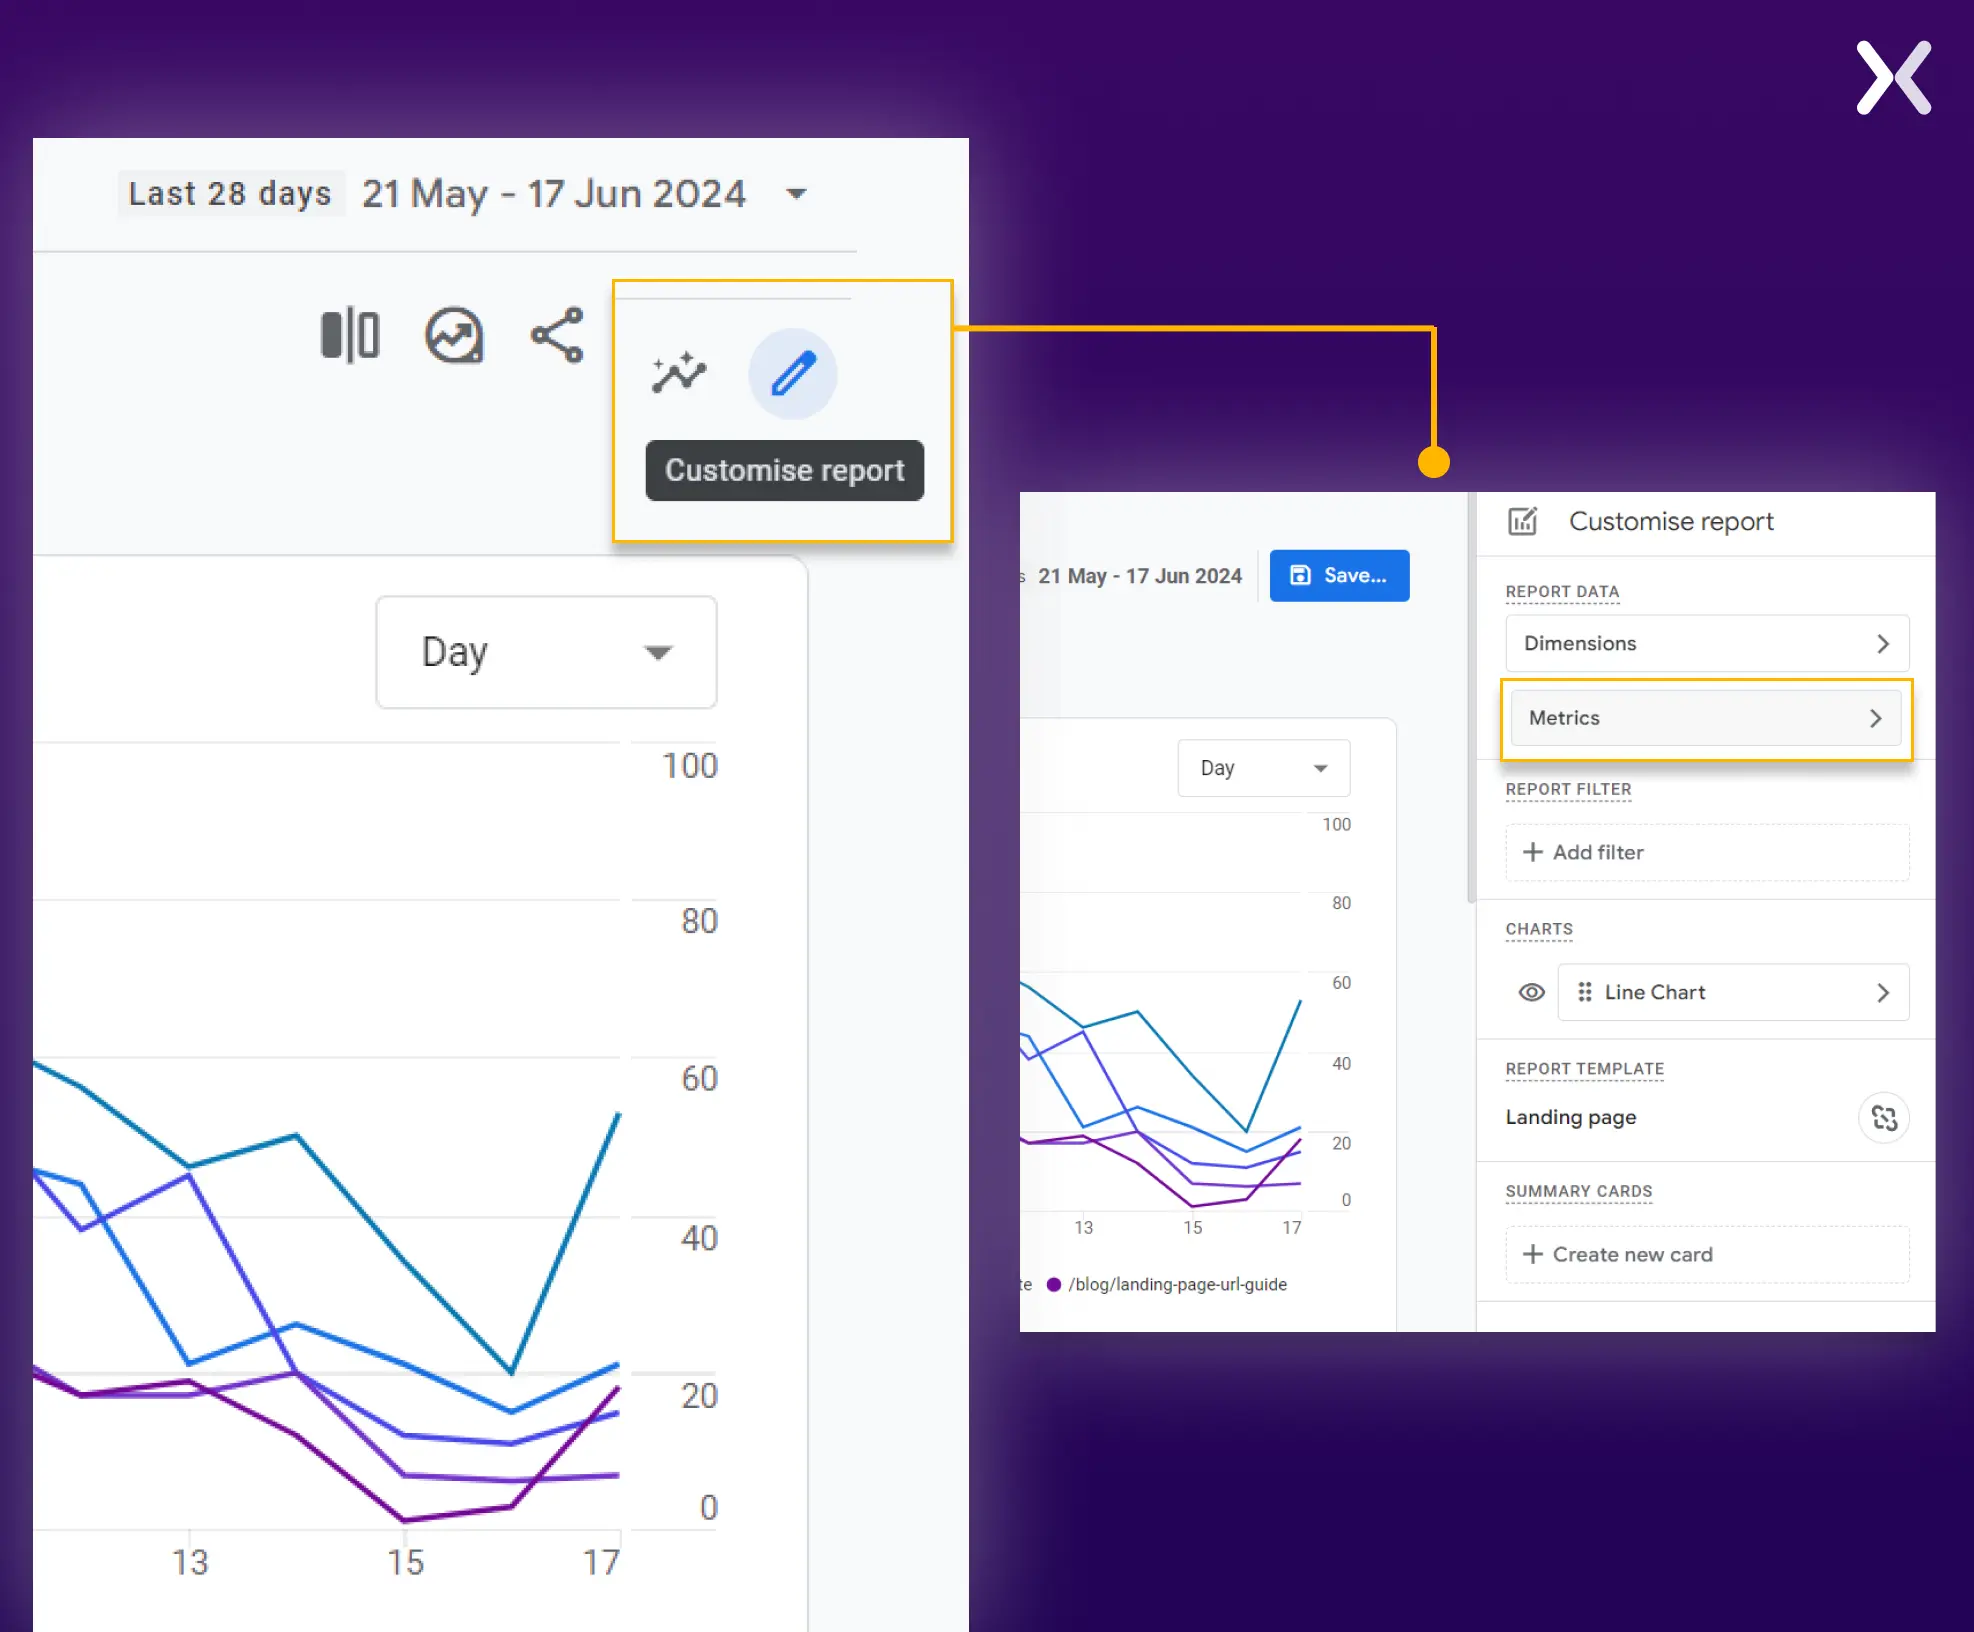 The metric section might already be filled out, but you can easily remove and update the older metrics with the new landing page metrics.
 Let’s start with the basics.
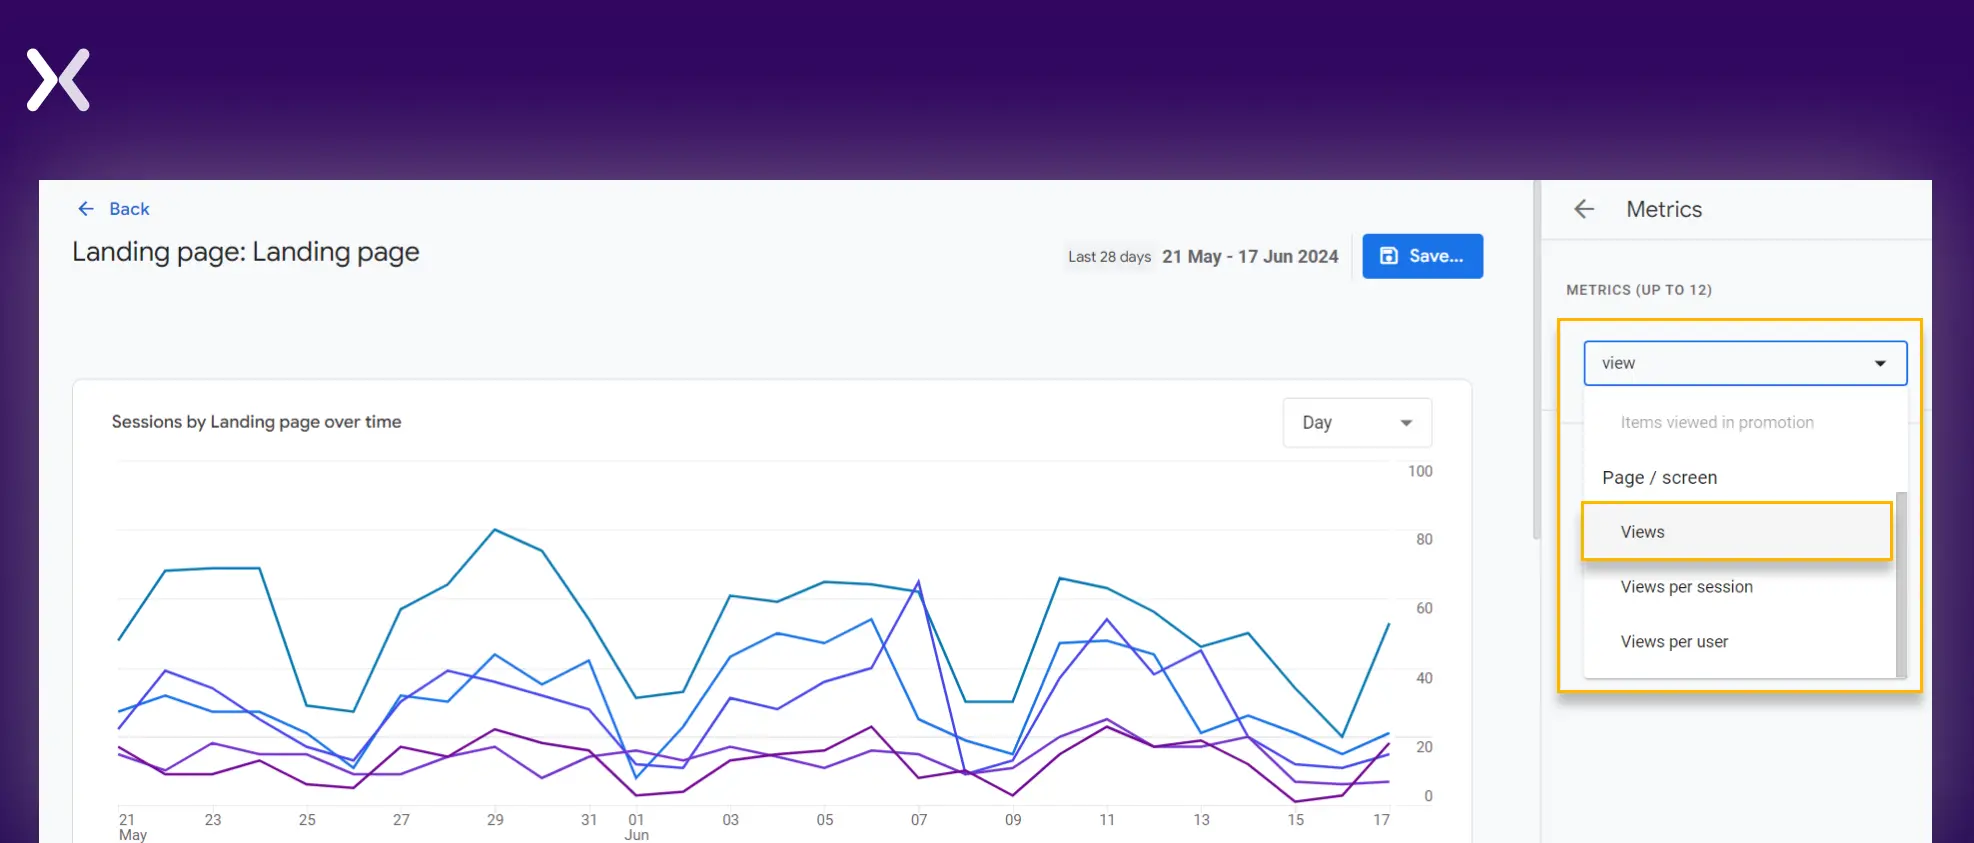
Step 3: landing page views
Simply search ‘view’ in the ‘Add metric’ box, and you will find three options related to views. Out of the three, you have to pick the first one.
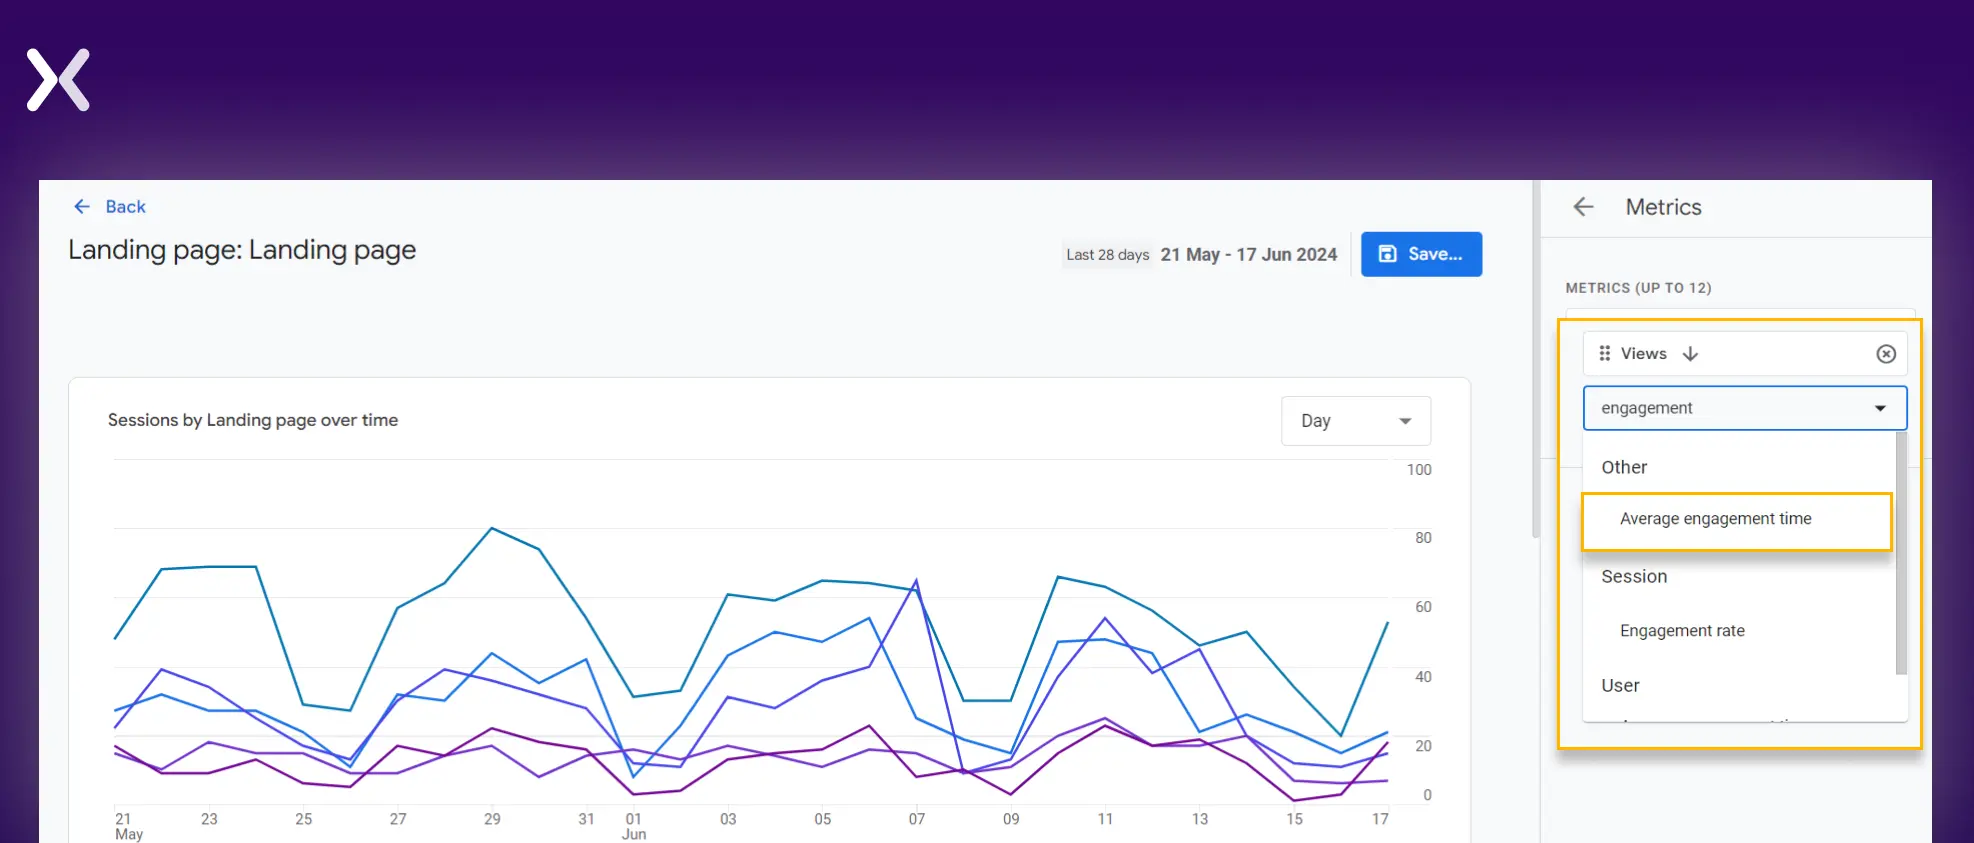
Step 4: average engagement time
Follow the same steps to add ‘average engagement time’ to your report.
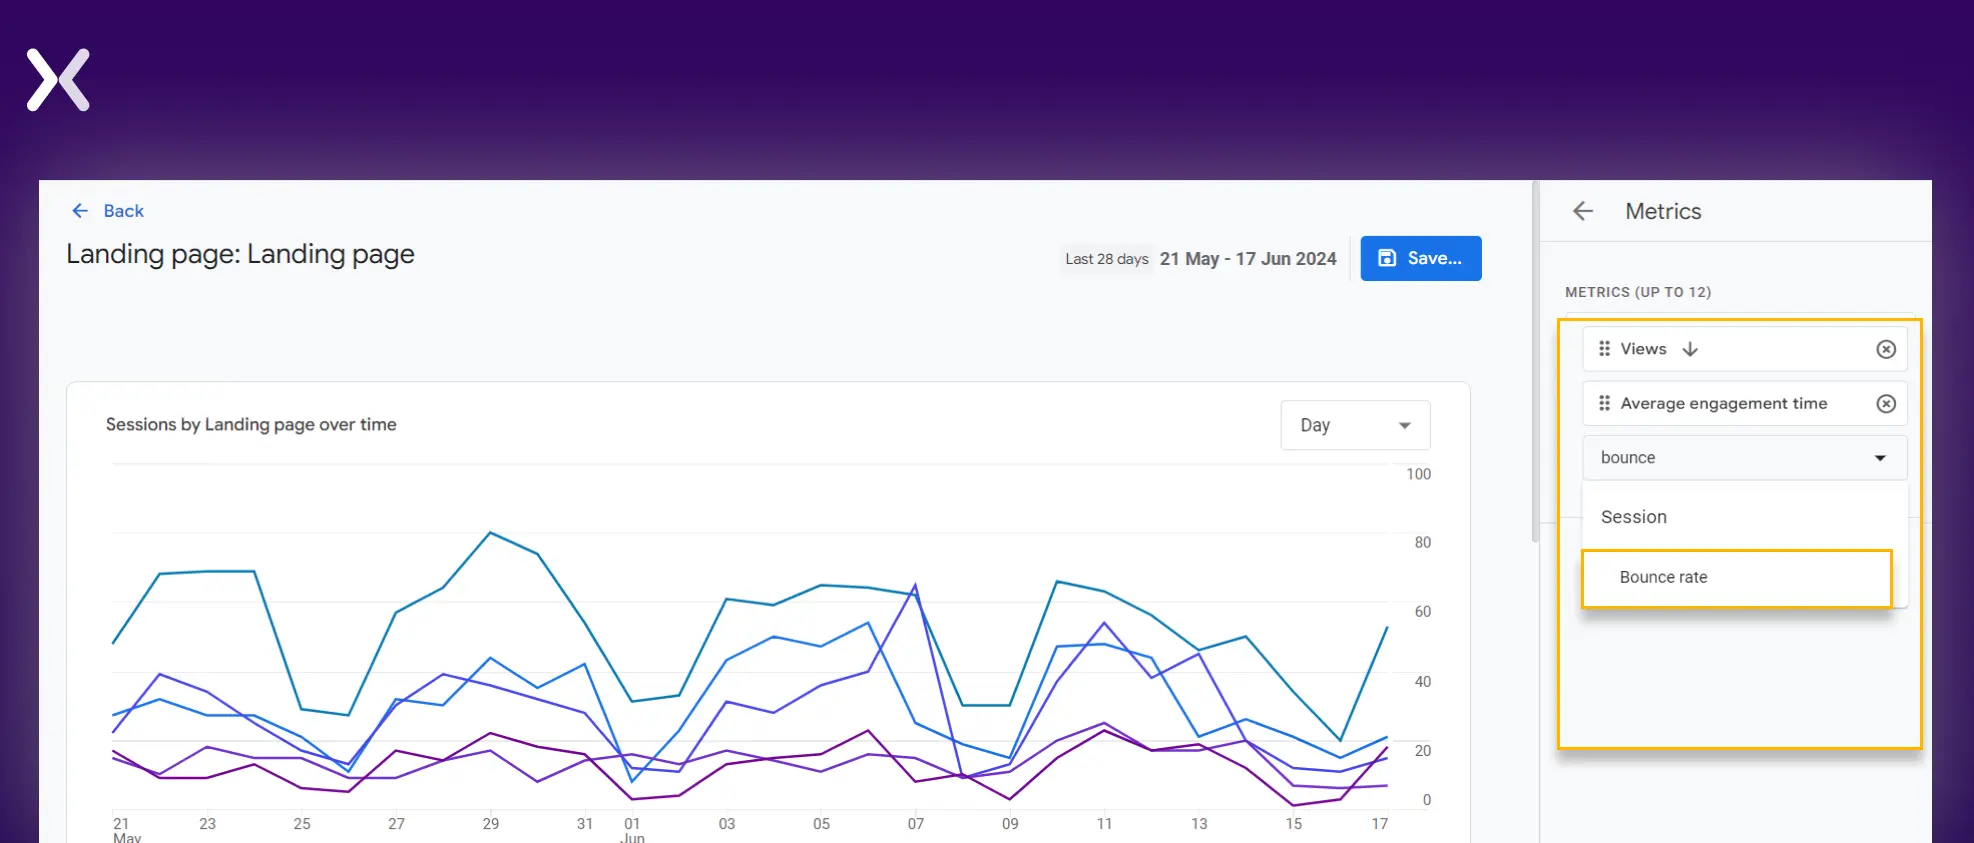
Step 5: landing page bounce rate
Follow the same steps to add ‘bounce rate’ to your report.
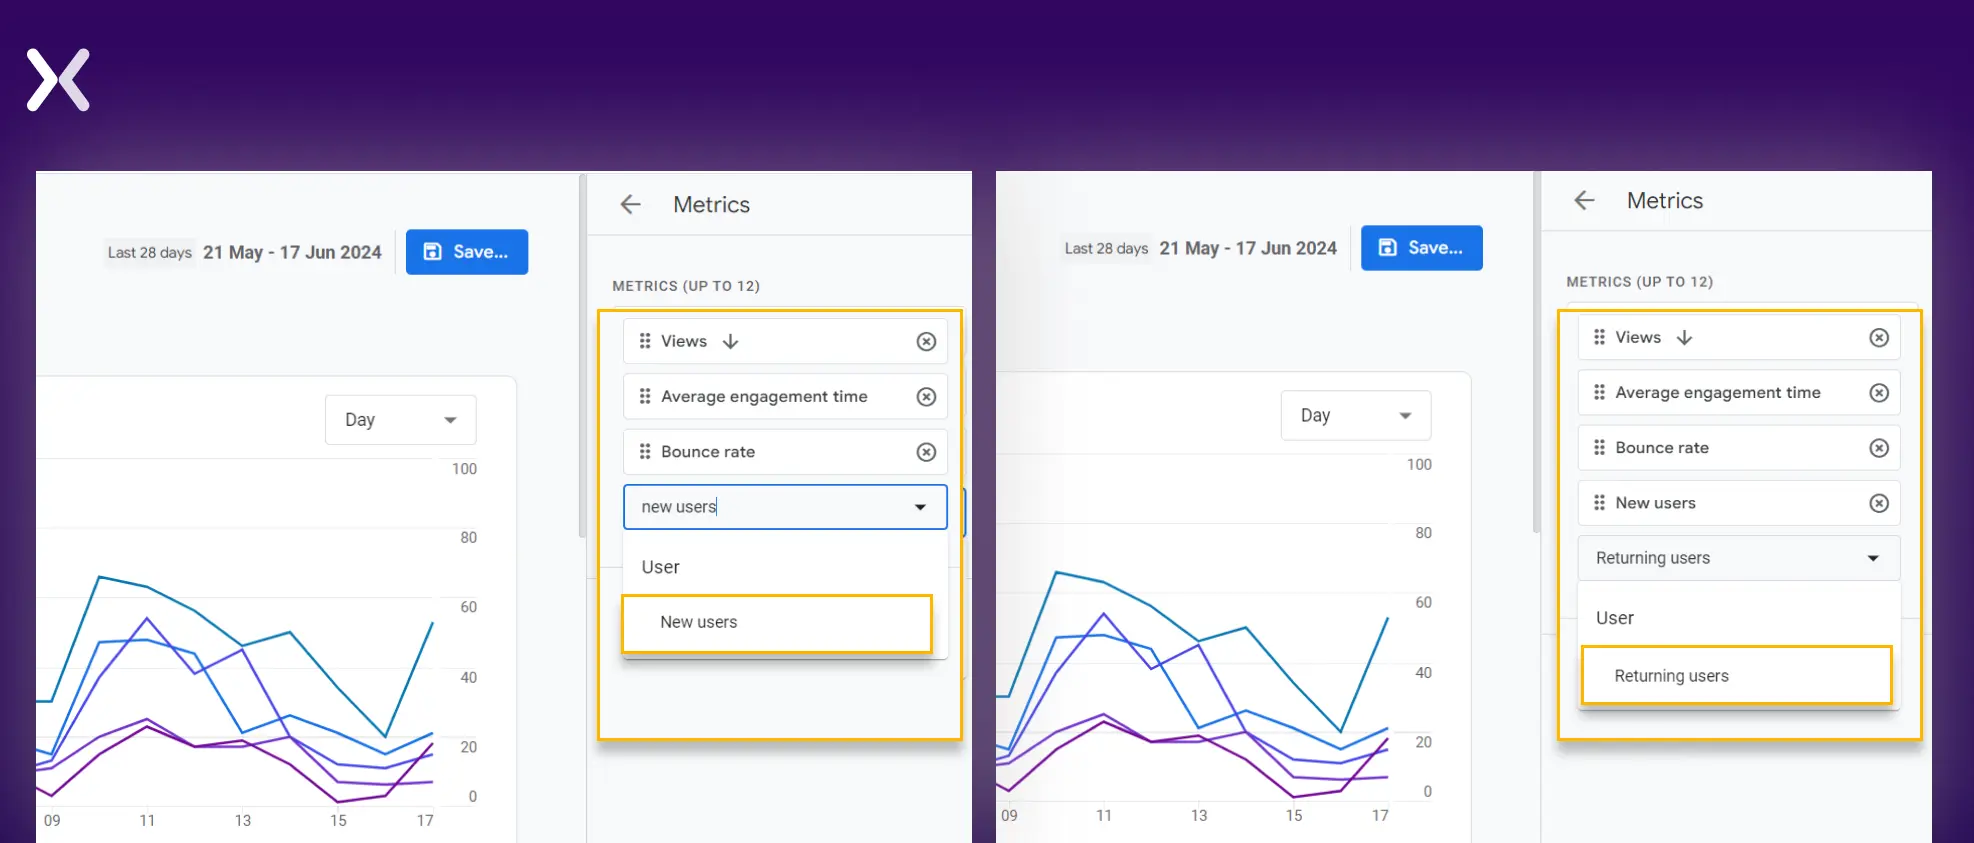
Step 6: return vs. New users
To add the metrics to your landing page analytics report, search for ‘new users’ and ‘returning users’ in the search bar.
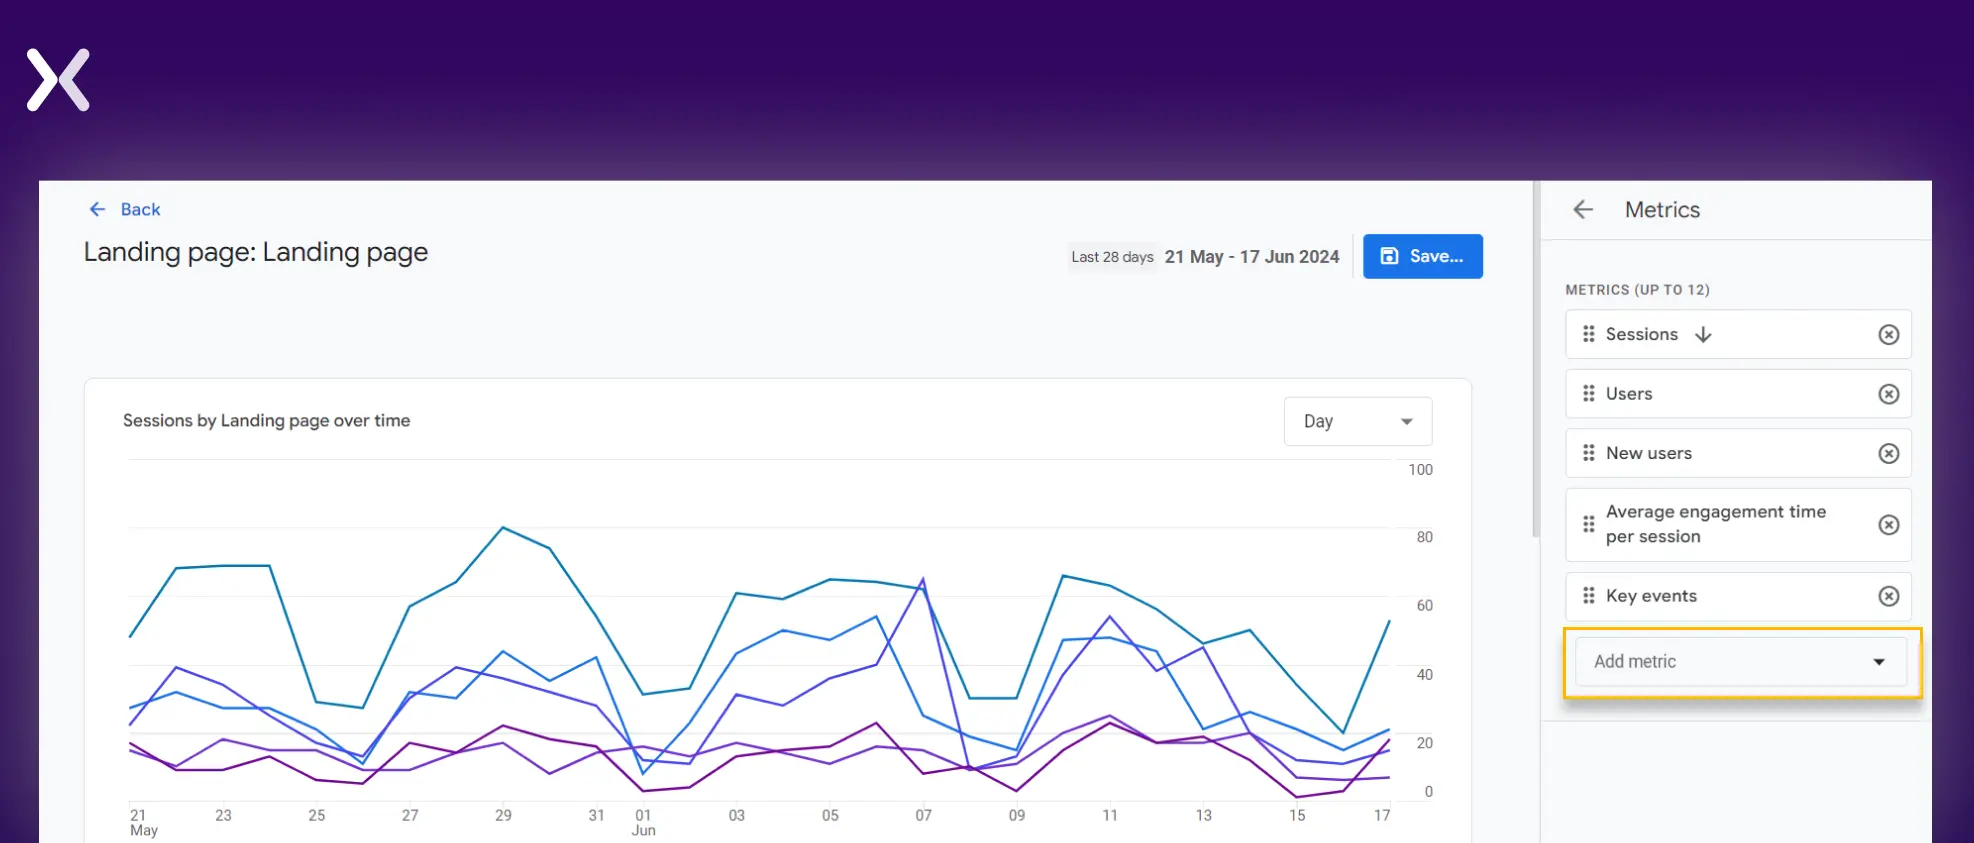
Step 7: landing page conversions
To do this, search for ‘key events’ and add them to the landing page report.
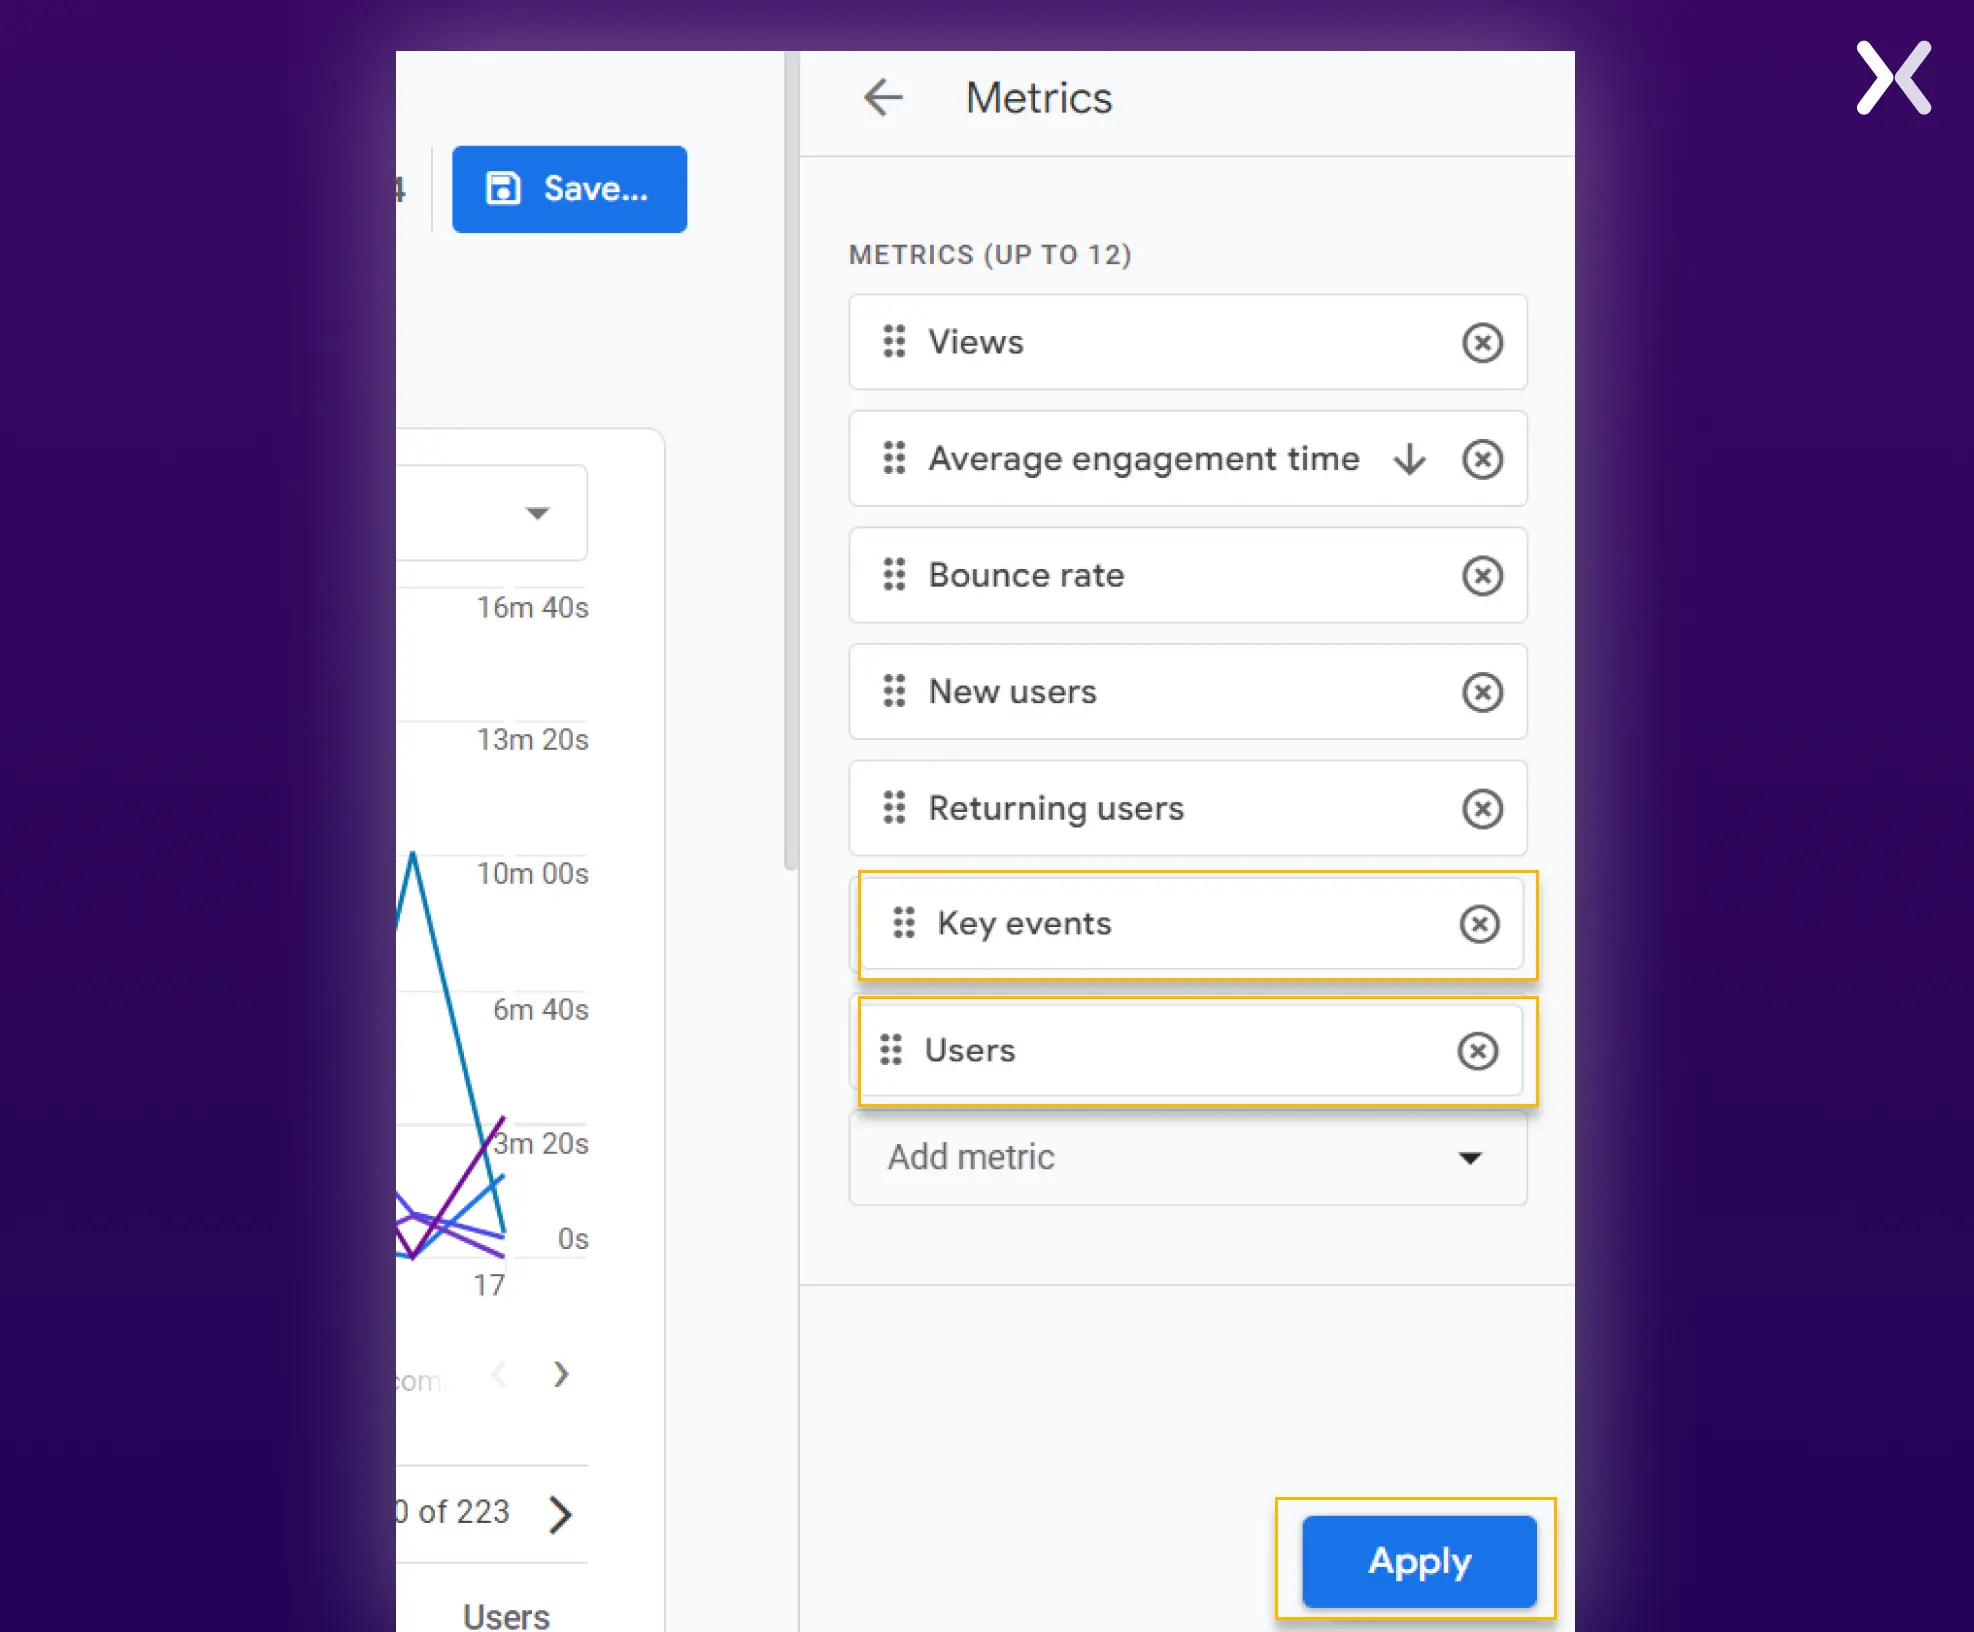 We have also added another metric, ‘ users, ‘ as seen in the image above. It gives the total number of visitors a landing page received. It will later help us calculate the conversion rate percentage.
Now click ‘apply’ and then the ‘save’ button (you can save changes to the current report or generate a new report; it is up to you). You can return to the main landing page report page, which will look like the one below.
We have also added another metric, ‘ users, ‘ as seen in the image above. It gives the total number of visitors a landing page received. It will later help us calculate the conversion rate percentage.
Now click ‘apply’ and then the ‘save’ button (you can save changes to the current report or generate a new report; it is up to you). You can return to the main landing page report page, which will look like the one below.
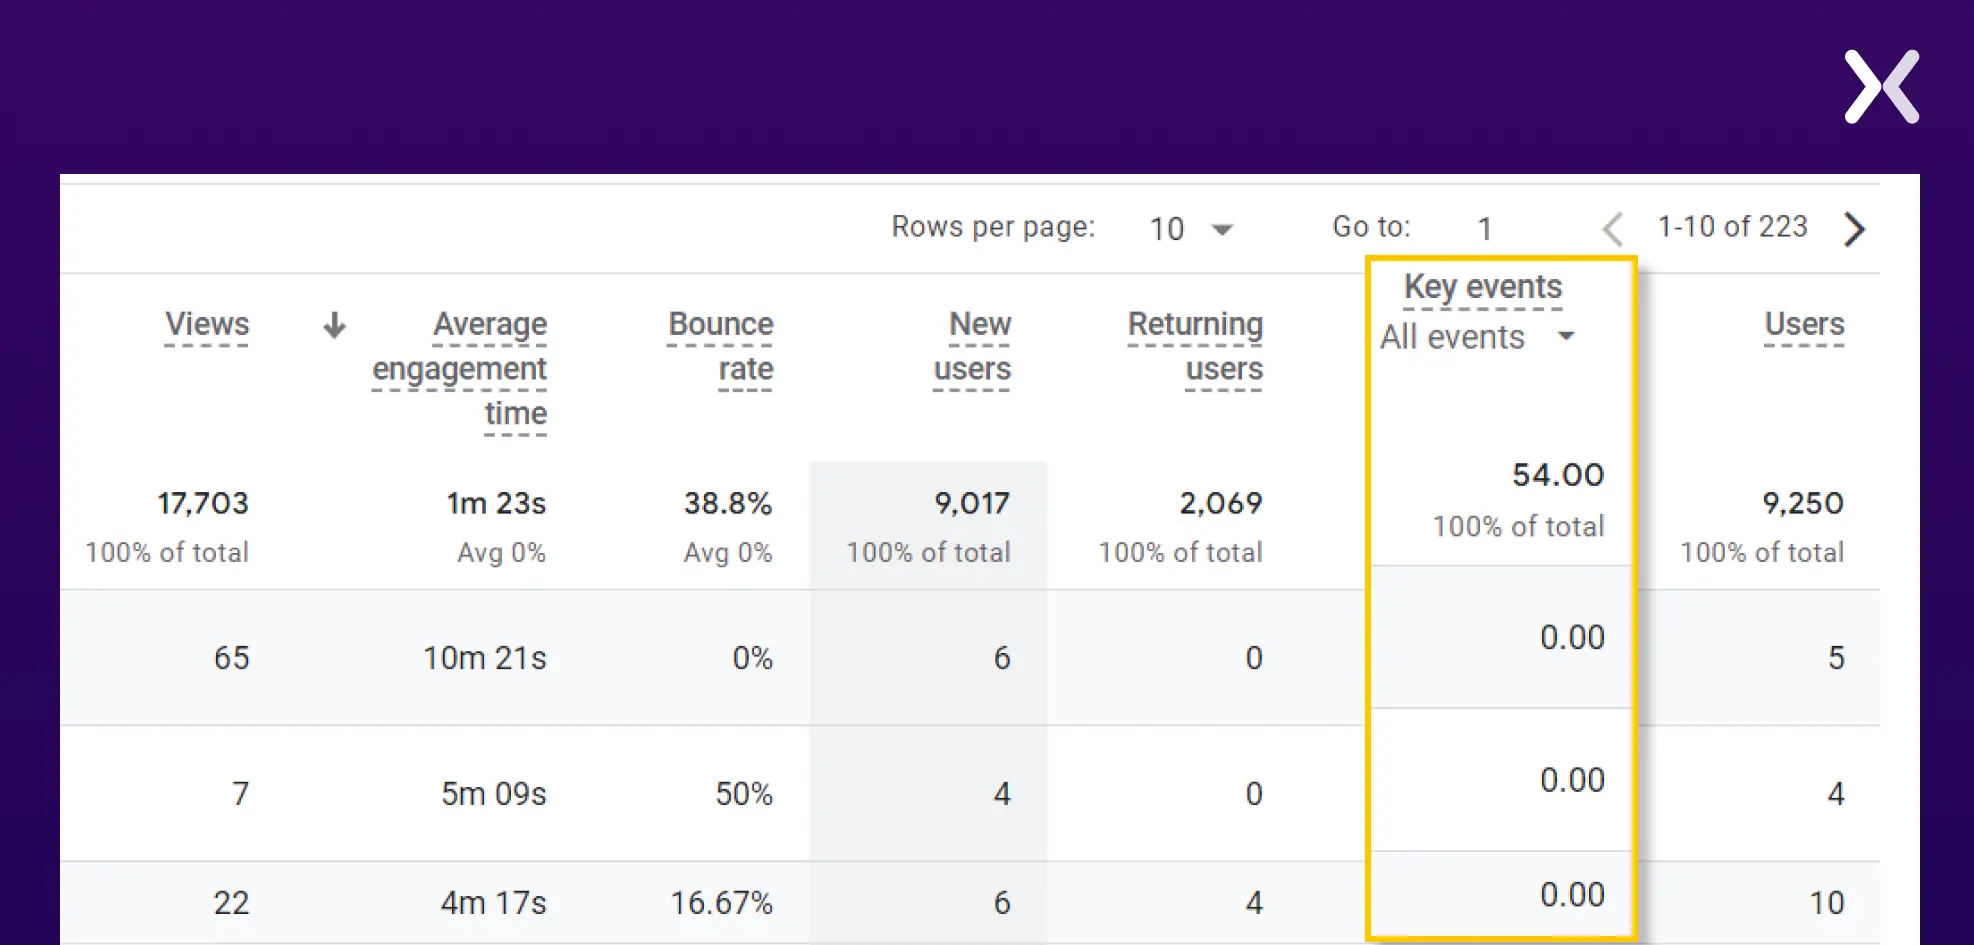 If you have set up various ‘Key events,’ you can click on ‘All events’ and select the specific one for which you want to see conversions.
Your landing page analytics report is almost ready now.
If you have set up various ‘Key events,’ you can click on ‘All events’ and select the specific one for which you want to see conversions.
Your landing page analytics report is almost ready now.
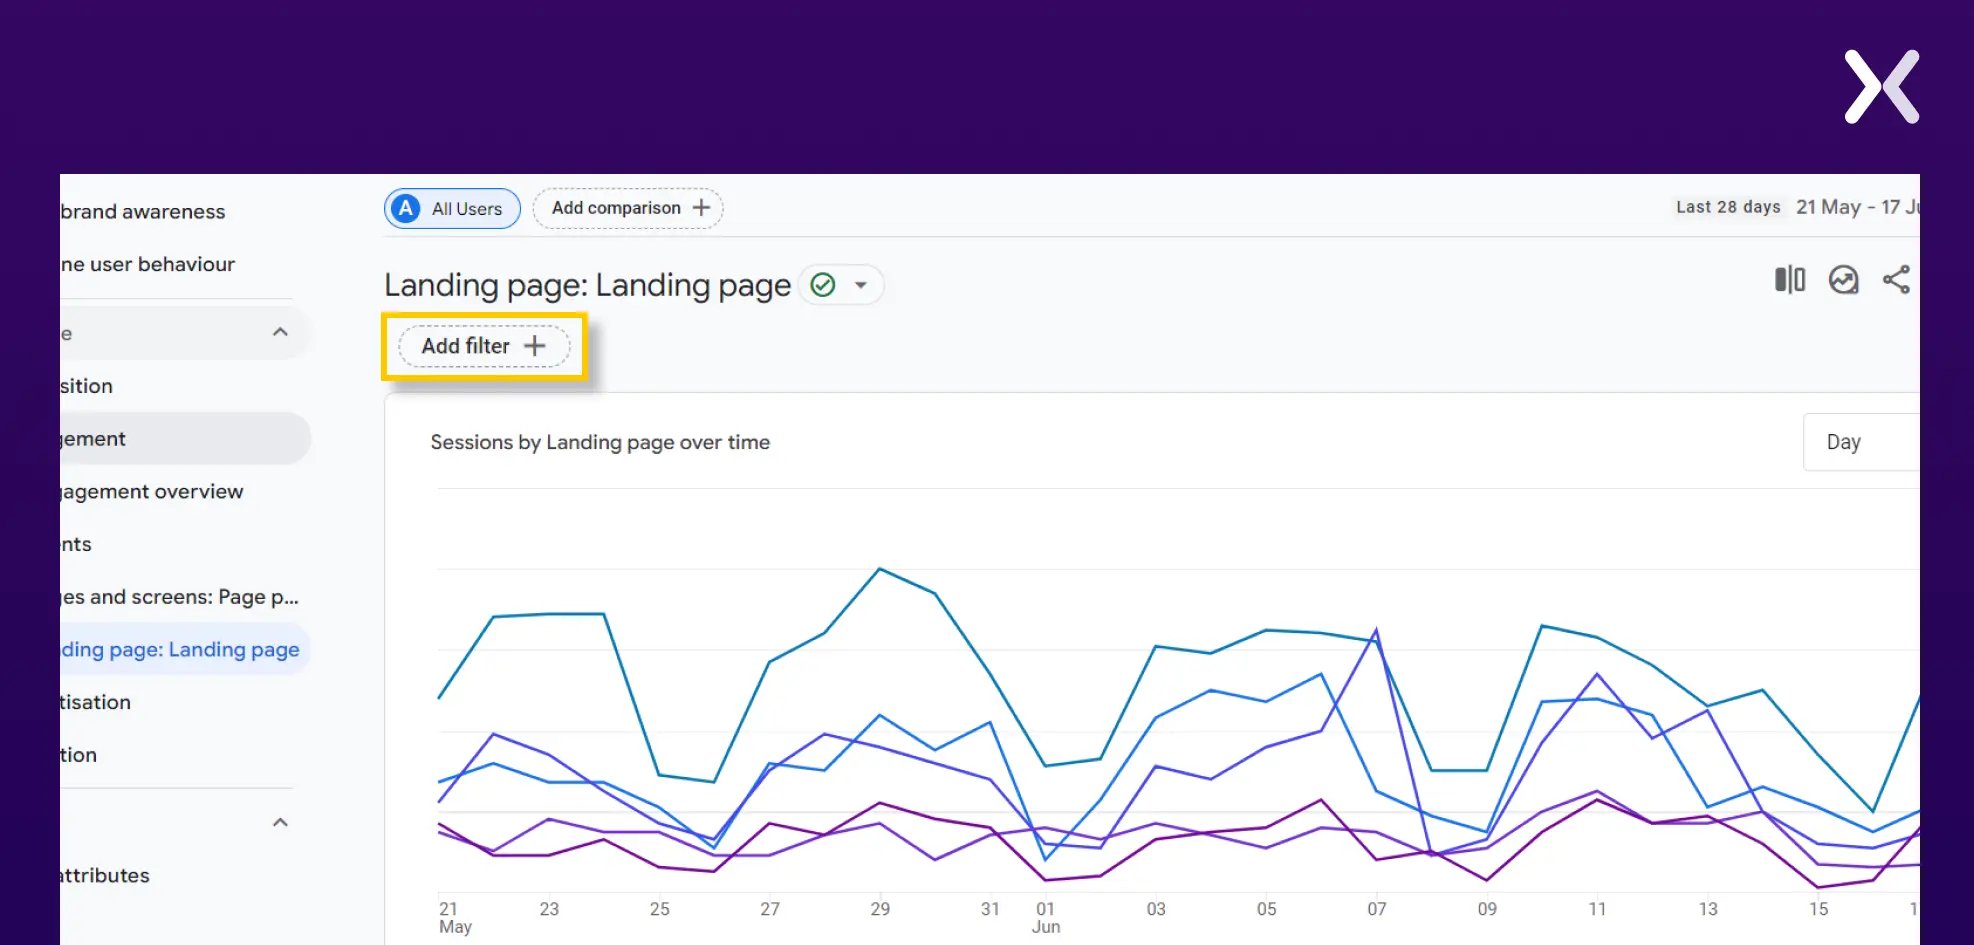
Step 8: source of the session
To include this metric in your report, you can’t add it directly. Instead, filter your entire landing page report by the session’s source. Here’s how: Click the ‘Add filter’ button on your main landing page report page.
 In the Dimension box, search for ‘Session source/medium.’
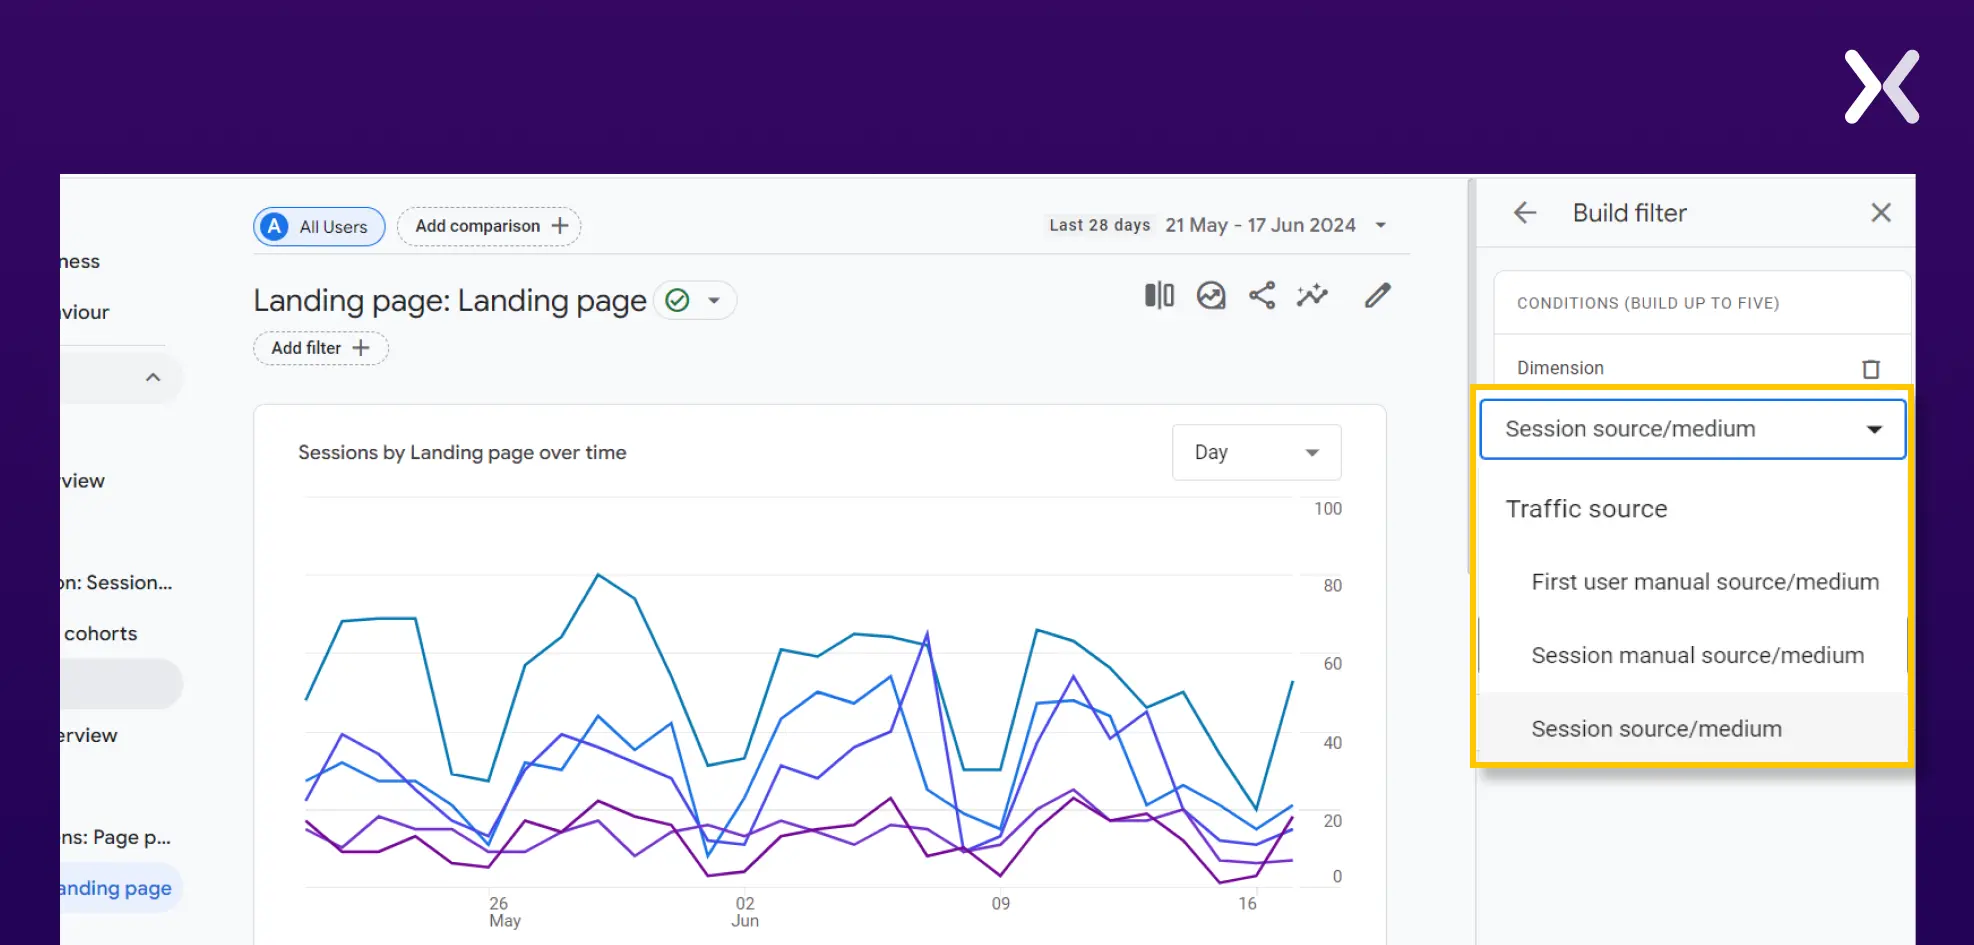 In ‘Match Type,’ select ‘exact match’ and choose the source/ medium for which you want to see the report for the metrics like new users, returning users, bounce rate, etc. Click ‘Apply’ at the bottom right corner, and you’re all set.
How to calculate conversion rate from GA4 report?
Let’s take an example. The landing page report below has been filtered for organic traffic.
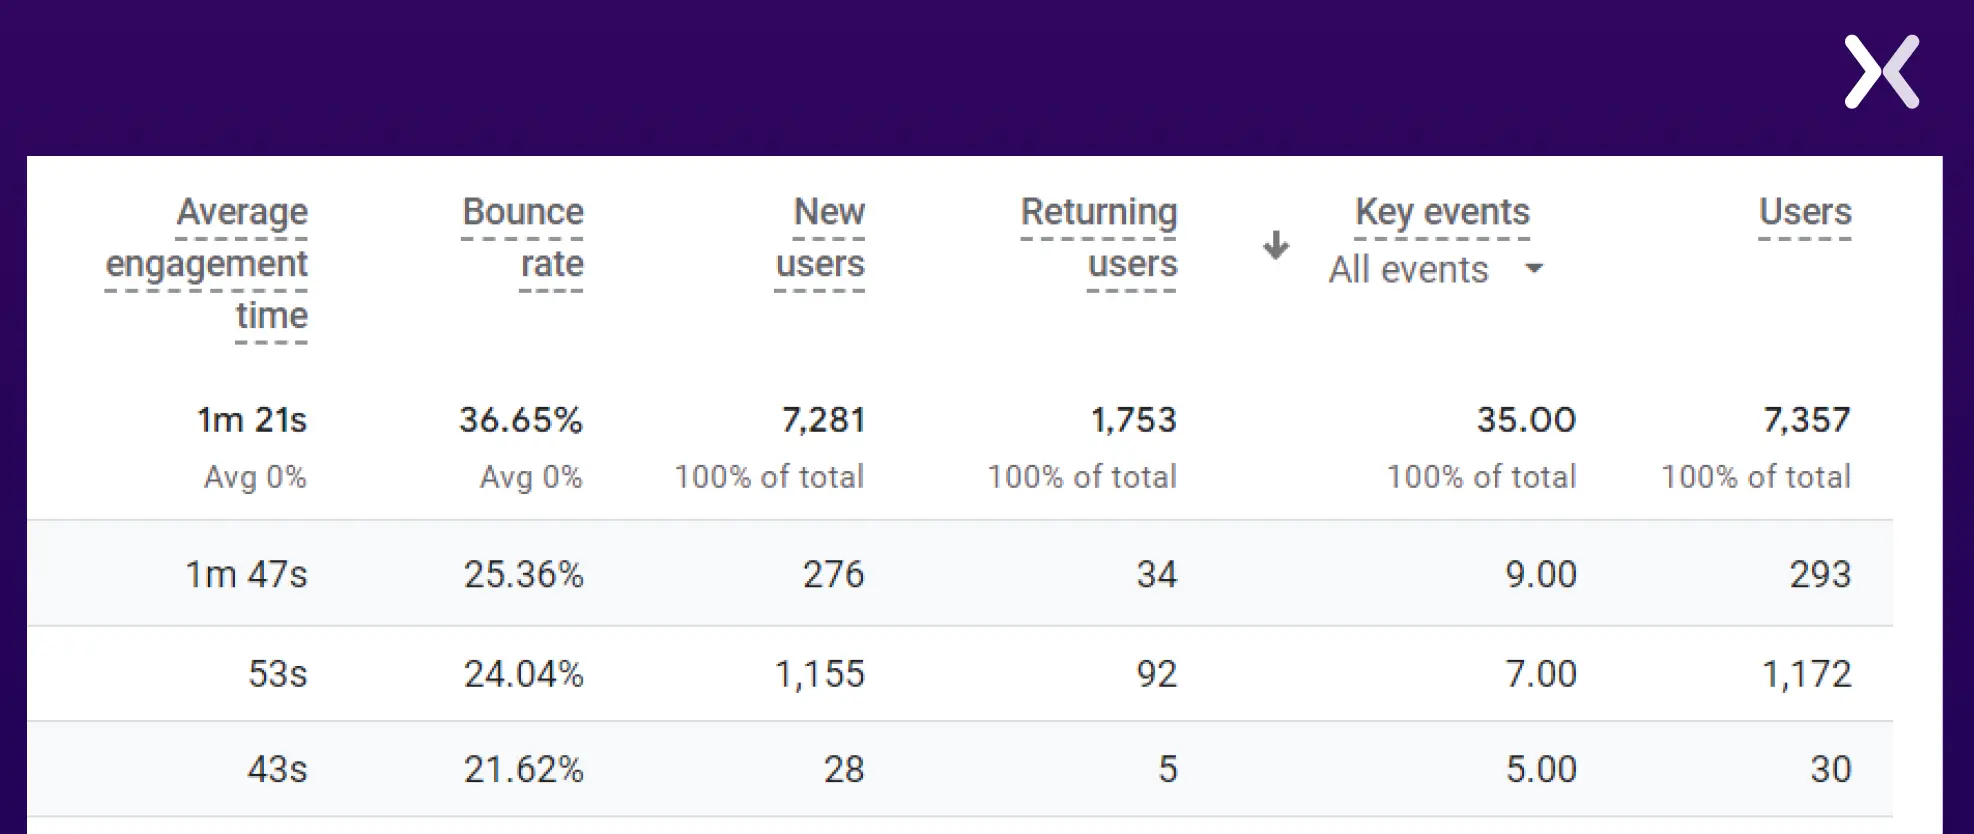 Using the metrics from row first.
Users= 293
Key Events= 9
Conversion rate= (9/293) * 100= 3.072%
Hence, the conversion rate for our first landing page is 3.072%.
Using the metrics from row first.
Users= 293
Key Events= 9
Conversion rate= (9/293) * 100= 3.072%
Hence, the conversion rate for our first landing page is 3.072%.
Build your landing page Analytics report with the right metrics
Effective landing page metrics can change your reports into valuable insights, guiding current and future marketing campaigns. Start by building a full landing page report in Google Analytics. While the metrics discussed in this blog post are essential, you can always add more to make sure a thorough understanding of your landing page performance. By customizing your reports to include relevant data, you can better assess the effectiveness of your landing pages and make informed decisions to optimize your marketing strategies.
Related Articles: