You are already paying for the click. The landing page decides whether that click turns into revenue or waste. Most PPC guides stop at “build a good landing page”, message match, clear CTA, trust signals. Fine. But that is chapter one. This guide is chapter two: how to take a live PPC landing page and systematically squeeze more conversions out of it, using your own data rather than someone else’s checklist. We have done this on hundreds of PPC landing pages since 2014. The six steps below are the same ones we follow whether the client spends $5K or $500K per month on Google Ads. The steps stay the same. The data changes everything.
PPC landing page optimization is the process of improving a live landing page so that it converts a higher percentage of visitors from paid traffic, Google Ads, Microsoft Ads, Meta Ads, or any other paid channel. The goal is to get more conversions from clicks you are already paying for. This is distinct from PPC landing page best practices, which cover what a good page should look like when you build it. Optimization starts after the page is live: you collect data, find what is not working, test a fix, measure the result, and repeat. Best practices are the starting point. Optimization is the compound interest.
That gap is not explained by better offers or more traffic. It is explained by pages that have been through more optimization cycles. The top 10% did not start at 11%. They tested their way there.
Before changing anything, establish a baseline. Pull at least 30 days of data from GA4 (linked to your Google Ads account) and answer these questions:
This audit tells you what is happening. It does not tell you why. That comes in Step 2.

The audit tells you what. Now you need to find out why people are leaving without converting.
Heatmaps and scroll maps (Hotjar, Microsoft Clarity) reveal where visitors click, how far they scroll, and which elements they engage with. If 60% of visitors never reach your form, no amount of CTA optimization will matter, the page needs restructuring.
Session recordings let you watch real paid visitors move through your page. Look for rage-clicking on non-clickable elements, u-turns (scrolling back up in confusion), and form hesitation. We have found more conversion killers in 20 session recordings than in 20 analytics reports. The recordings show you the frustration that the numbers only hint at.
Form analytics tell you where visitors abandon your form. Which field causes the most drop-offs? How many visitors start the form but never submit? Tools like Hotjar and Zuko track field-level abandonment.
On-page surveys give you the visitor’s own words. A single question, “What stopped you from completing this form?”, surfaces objections that no analytics tool will ever reveal.
PPC-specific insight: Segment your diagnostic data by traffic source. Visitors from branded search behave differently from those arriving via competitor keyword ads. A page that works for one source may fail for the other, and the diagnosis will differ.
“Let’s try a different headline” is not a hypothesis. A hypothesis links a specific problem from your data to a proposed change and a measurable expected outcome.
Format: “Based on [data/observation], we believe that [change] will [outcome], which we will measure by [metric].”
Example: “Based on heatmap data showing 65% of visitors clicking the hero CTA but only 12% completing the form (Step 2), we believe that reducing the form from 7 fields to 3 will increase form completion rate by 20-30%, measured by form submission events in GA4.” This format forces precision. Without it, teams test whatever the loudest person suggested or whatever a competitor is doing. Every hypothesis should trace back to a specific data point from Steps 1-2. A typical audit produces 10-15 hypotheses. Most will never be tested, Step 4 decides which ones are worth running.
Ten hypotheses, limited time, finite budget. Something has to go first. Without a scoring framework, the decision defaults to whoever has the most seniority, and you end up testing hero images when the real conversion killer is the form. At Apexure, we use the EPIC framework: each hypothesis is scored 1-5 on four factors:
PPC-specific prioritisation rule: For paid landing pages, weight the Impact score more heavily than for organic pages. A 2% conversion lift on a page receiving 10,000 paid clicks per month translates directly to lower CPA and higher ROAS, the financial impact is immediate and quantifiable.
Paid traffic has an advantage over organic for testing: you control the volume. You can increase ad spend to accelerate a test toward statistical significance, and you can segment traffic by campaign or audience to run more targeted experiments.
Practical testing rules for PPC landing pages:
Win or lose, the test has value, but only if you write down what you learned. A winning variant gets implemented. A losing one gets documented with a note on why it lost, which often generates the next hypothesis. After 10-20 cycles, you have something no competitor guide can give you: a detailed, evidence-based understanding of what your specific audience responds to. That accumulated knowledge is the real competitive advantage, not any single test result.
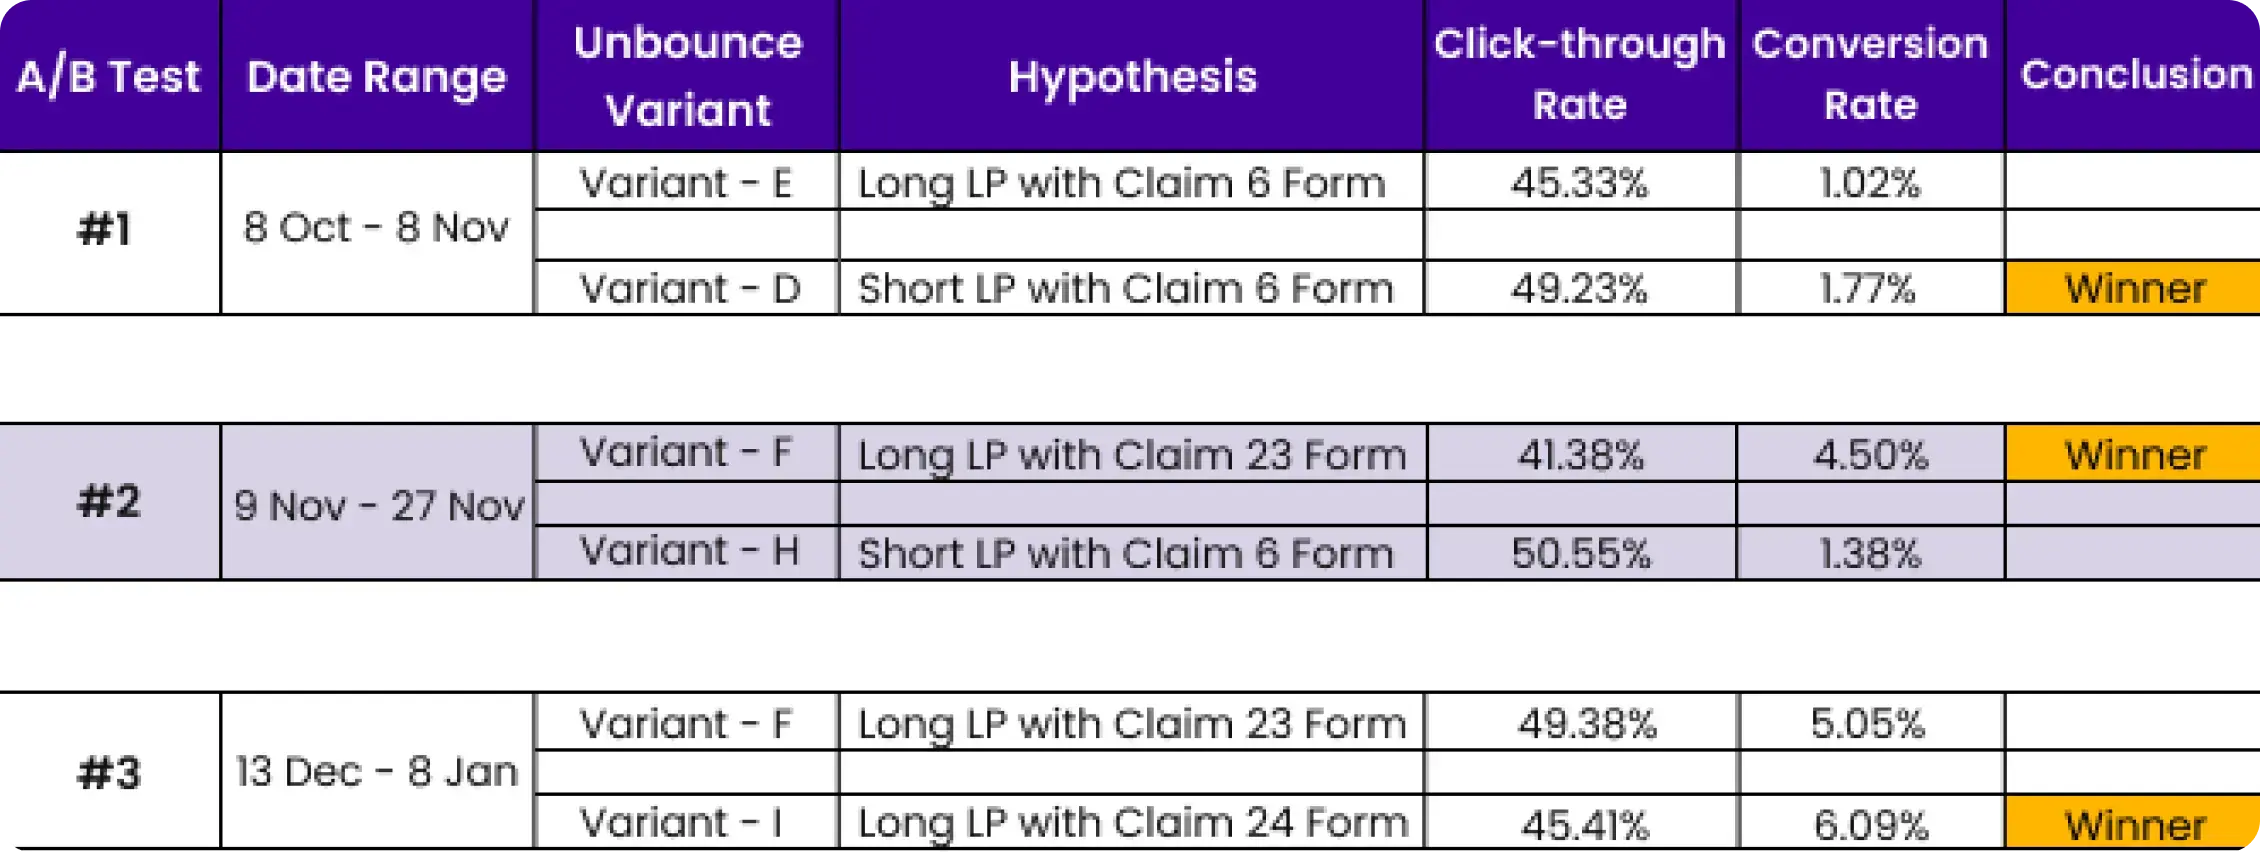
Reclaim My PPI Tax, a UK financial services company, ran PPC campaigns to a single-step lead capture form. The page converted at 4.33%. Our audit (Step 1) flagged the long form and low mobile conversion rate. Session recordings (Step 2) showed visitors hesitating at the fourth form field and abandoning.
We hypothesised (Step 3) that a multi-step form with progress indicators would reduce perceived friction. After prioritising this over six other hypotheses using EPIC (Step 4), we ran the A/B test (Step 5). Result: conversion rate jumped to 6.09%, a 41% increase, from the same paid traffic and the same offer.
Quality Score has three components: expected click-through rate, ad relevance, and Landing Page Experience. Of the three, Landing Page Experience is the one you can most directly control, and the one most advertisers neglect. Google’s 2025 AI-driven quality model goes deeper than the old keyword-matching system. It now evaluates:
AI Max and Final URL Expansion: Google's AI Max for Search campaigns (broadly available in 2026) can override your chosen landing page URL if its AI determines another page on your site would perform better. To maintain control over your landing page experience, use URL exclusions and monitor the "Final URL" column in your campaign reports. Landing page quality is now a factor in whether Google shows your page or substitutes one it prefers.
You do not need a 30-metric dashboard. These are the numbers that directly connect landing page performance to ad spend, and that change when optimization works:
| Metric | What It Tells You | Target |
|---|---|---|
| Conversion rate | Percentage of visitors who take the desired action | Median 4-5%, top 10% hit 11%+ |
| Cost per conversion (CPA) | How much each lead or sale costs | Below your target CAC, varies by industry |
| Quality Score | Google's 1-10 rating of keyword + ad + LP quality | 7+ (triggers CPC discounts) |
| Landing Page Experience | Google's sub-score for your page specifically | "Above average" |
| LCP (Largest Contentful Paint) | How fast the main content loads | Under 2.5 seconds |
| INP (Interaction to Next Paint) | How fast the page responds to user interaction | Under 200ms |
| Form start rate | Percentage of visitors who begin the form | Compare to form completion rate to find drop-off |
| Scroll depth | How far visitors scroll before leaving | At least 70% should reach the primary CTA |
Track these monthly at minimum. After every A/B test, update your baseline numbers so you can see the compound effect of optimization over time.
The process above gives you the system. This section gives you the specific changes worth testing, the moves that show up most often in our client work.
The visitor clicked your ad because it promised something specific. Your landing page must deliver on that promise within the first 2-3 seconds. If the ad says “Get a Free CRO Audit,” the landing page headline should contain those exact words, not a clever variation. We see message mismatch on roughly half the PPC landing pages we audit. The fix sounds simple, mirror the ad headline in the landing page headline, use dynamic text replacement for ad groups with different keyword themes, and make sure the offer and CTA match what the ad promised. It sounds simple because it is. Yet half the pages we see still get it wrong.
DTR (dynamic text replacement) was modern in 2020. It still works. But in 2026, AI-powered personalisation has moved well past swapping a headline keyword:
Speed kills conversion rates in the other direction. Every second of load time costs roughly 7% in conversions (web.dev). On paid traffic, that speed tax comes straight out of your ROAS. The 2026 Core Web Vitals thresholds that affect Quality Score:
The form is where intent meets friction. Most visitors who reach the form are interested, the page did its job. Whether they complete it depends on how much you ask for and how you ask for it.
Paid visitors are more sceptical than organic visitors. They know they clicked an ad. They are evaluating credibility faster, and they are more likely to bounce if something feels off. The question is not whether to include trust signals. It is where. Moving a client logo bar from the footer to directly below the hero headline, or placing a testimonial next to the form, can produce measurable lifts. Your heatmap data from Step 2 will tell you where visitors hesitate. That is where the trust signals belong.
"Apexure helped us improve our landing page conversion rate. All the work is done to a very high standard. The site's conversion rate has gone up, they listen well to their clients and deliverables are completed on time."
Google Optimize is gone (September 2023). SessionCam is now Glassbox. ClickTale is now Contentsquare. The tool environment has reshuffled. Here is what the 2026 stack looks like:
| Category | Tools | Cost |
|---|---|---|
| Analytics | GA4 (linked to Google Ads), Looker Studio | Free |
| Behaviour tracking | Microsoft Clarity, Hotjar, Contentsquare | Free, $99+/mo |
| A/B testing | VWO, Optimizely, Convert, AB Tasty | $99, $500+/mo |
| Landing page builders | Unbounce, Instapage, Landingi | $79, $299+/mo |
| Speed testing | PageSpeed Insights, GTmetrix, WebPageTest | Free |
| Form analytics | Zuko, Hotjar form analysis | Free, $150+/mo |
| Competitive intel | SpyFu, iSpionage, Ahrefs | $33, $99+/mo |
Budget-conscious starter stack: GA4 + Microsoft Clarity + your landing page builder’s built-in A/B testing. This covers analytics, behaviour tracking, and experimentation for free.
Tool note: If you are referencing older guides that mention SessionCam or ClickTale, both were acquired by Contentsquare. Google Optimize was retired in September 2023. Update your stack accordingly.
Not everything labelled “2026 trend” deserves your attention. Here is what actually matters and what you can safely ignore for now.
Google’s AI quality model (rolled out in 2025) uses machine learning to assess landing page quality beyond keyword matching. It evaluates navigation, trust signals, engagement behaviour, and page speed holistically. This is not a future prediction. It is already affecting Quality Scores and CPCs.
AI Max Final URL Expansion allows Google’s AI to substitute your landing page URL with another page on your site if it predicts better performance. This means landing page quality is no longer just about conversion. It is about whether Google even shows your page. Monitor the “Final URL” column and use URL exclusions to maintain control.
INP as a Core Web Vital (replaced FID in March 2024) means interactivity matters more than it used to. Pages with heavy JavaScript, slow forms, or unresponsive buttons now face a measurable Quality Score penalty.
Performance Max landing page image pulling, Google now pulls images directly from your landing pages for PMax ad creatives. Your landing page imagery is not just for visitors; it is for ad generation.
AI-generated landing pages (offered by several platforms) can produce functional pages quickly, but they lack the strategic intent that comes from understanding your specific audience, offer, and competitive position. Use AI for drafting copy or generating layout variations to test, not as a replacement for the optimization process.
Fully automated testing promises hands-free optimization. In practice, algorithms still need sufficient data to learn, and they optimise for the metric you give them, which may not match lead quality or lifetime value. Supervised testing (human hypothesis + automated execution) outperforms fully automated approaches for complex B2B and high-ticket offers.
We started building PPC landing pages in 2014. The early ones were good. The ones we build now are measurably better, not because of talent, but because of 10 years of test data telling us what actually moves conversion rates. Over 400 clients later, the process has not changed. Each engagement follows the same six steps with a dedicated designer, developer, QA analyst, and account manager, with separate design QA, dev QA, and client review stages. We build on Unbounce, WordPress, Instapage, Kajabi, and Framer depending on the client’s existing stack and testing needs.
A US health insurance company came to us with a PPC landing page converting at 3.2%, below the 6.6% median for landing pages. Heatmap analysis revealed two issues: the form asked for a full street address upfront (unnecessary friction for a quote request), and the primary CTA was below the third scroll on mobile.
We built a dynamic landing page that pre-filled the location field based on visitor IP and moved the CTA to a sticky mobile footer. Conversion rate jumped to 5.1%, a 59% improvement, with no changes to the copy, offer, or ad targeting.
Founder & CEO of Apexure, Waseem worked in London's Financial Industry. He has worked on trading floors in BNP Paribas and Trafigura, developing complex business systems. Waseem loves working with Startups and combines data and design to create improved User Experiences. Read more


Drive More Sales or Leads With Conversion Focused Websites and Landing Pages
Get Started

Eleven percent of Meta ad rejections in 2026 trace back to one problem: the landing page does not...

A B2B SaaS company spends $30,000 per month on Google Ads and Meta Ads. Both campaigns drive traffic...
Get quality posts covering insights into Conversion Rate Optimisation, Landing Pages and great design