
From one claim in a hundred to six.
Reclaim My PPI Tax secures tax rebates for its clients, entirely online. Its claim form needed the background of the case as well as personal details, and only 1.02 percent of visitors finished it. We tracked every step in GA4, tested a shorter landing page, rebuilt the form in four stages and added a gateway page. The end-to-end conversion rate reached 6.09 percent, almost 500 percent up.
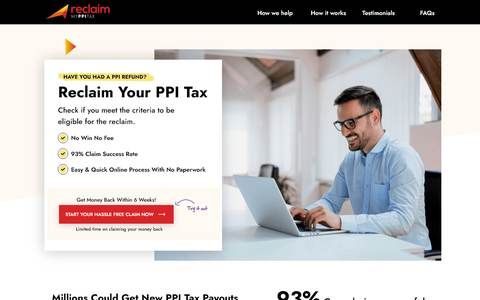
- Start1.02%end-to-end conversion when we began
- Shorter page1.77%after the shorter page won its test
- New form4.33%after the four-stage claim form
- Gateway6.09%after the gateway page, almost 500% up
- Three steps, each experiment run for around a month.As published March 2023.
- Client
- Reclaim My PPI TaxTax rebate claims, fully online
- Sector
- Financial claimsUnited Kingdom
- Platform
- UnbounceUnbounce pages, Laravel form
- Scope
- Landing pages, claim form, trackingA/B tests, GA4 funnel, gateway page
- Measured
- March 2023GA4 funnel tracking
- Services
- Conversion rate optimisationCase study · March 2023
A claim form that lost people before the end
Reclaim My PPI Tax runs its whole service online, with no phone calls, so the claim form is the business. At the start of the project 1.02 percent of visitors completed it end to end.
Case details as well as personal ones
A claim needs background on the case, which takes longer to give than a name and an address. That length put some potential claimants off part way through, which cut the volume of leads and the revenue behind them.
No view of where people were leaving
The registration ran over several stages and nobody could see which one was losing people. Before redesigning anything we put GA4 tracking on every step to find the leakage points, and ran competitor analysis and market research alongside it.
A skilled team without the hands to test
The client's own team was skilled, but it did not have the people to run a redesign and a testing programme alongside its campaigns. Our conversion-focused UX and UI designers took the lead, with the client and its PPC team in a shared Slack channel.
Significantly improve the conversion rate of leads without compromising lead quality, optimise the impact of its digital campaigns, and maximise its revenue.The brief, as the case study records it
What we tested, and what we rebuilt
Each step was an experiment of around a month, with the paid traffic split in Unbounce between the existing version and the new one.
A shorter landing page against the long one
With tracking in place we designed a shorter landing page and ran it against the existing long one. The shorter page had a click-through rate almost 10 percent higher and a lead conversion rate of 1.77 percent against 1.02. That settled the page format. The next step was the form.

A claim form in four stages, easy questions first
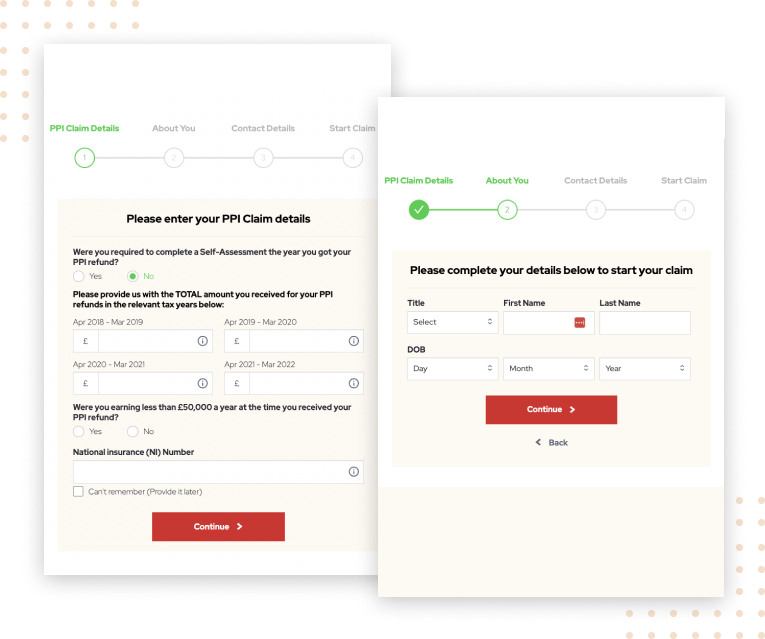
The registration page became a four-stage form so the process looked less daunting. The easier questions moved to the front to ease people in, and some fields sat side by side rather than in a single column, which was easier to read. Fewer people dropped out and the conversion rate went from 1.77 percent to 4.33.
Mockups signed off, then a month of traffic
Every new version of the page and the form went to the client as an InVision mockup first. Once the client and the stakeholders had signed off, the A/B test was set up in Unbounce to send the paid traffic to the new version. Each experiment ran for around a month.
A gateway page before the four stages
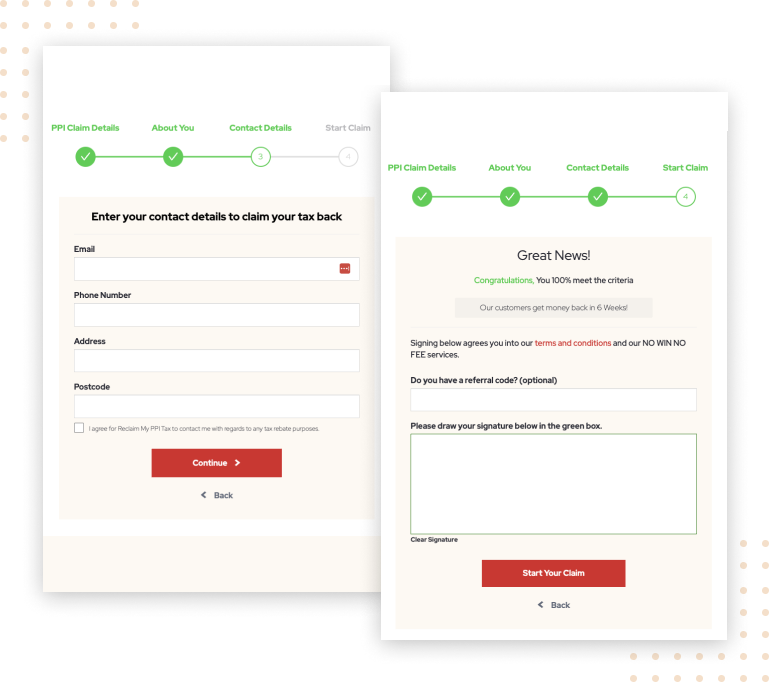
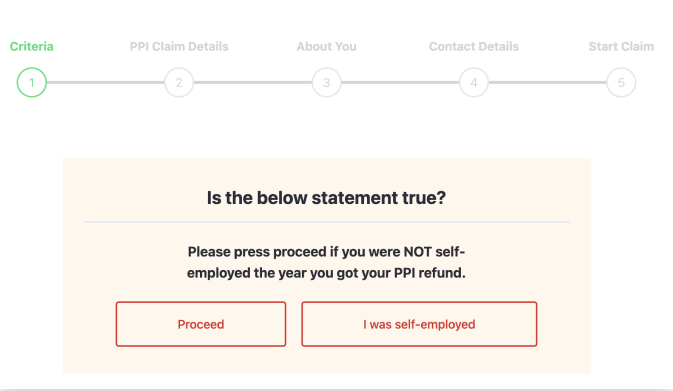
GA4 showed that step one of the registration had a 25 percent completion rate while steps two, three and four ran at around 60 percent. We A/B tested a gateway page: once it was completed, a Proceed button opened the remaining three steps. Completing it gave people a sense of achievement, and the end-to-end rate went from 4.33 percent to 6.09.
What the numbers did
The rates at each step, from GA4 funnel tracking across the whole registration, as published in the case study in March 2023.
From 1.02 percent at the start, through 1.77 and 4.33 as each step shipped. Almost 500 percent up on the baseline.
The four-stage claim form on its own took the rate from 1.77 percent to 4.33, with fewer people dropping out.
What GA4 showed before the gateway page: a quarter finished step one, while steps two to four ran at around 60 percent.
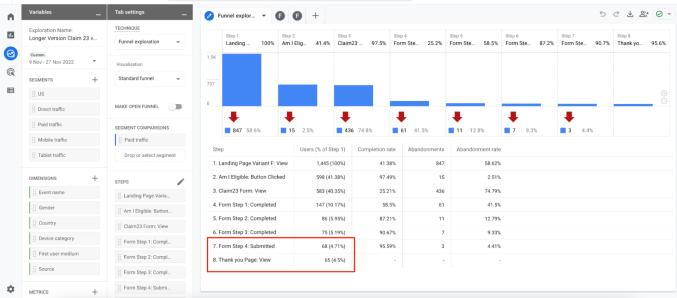
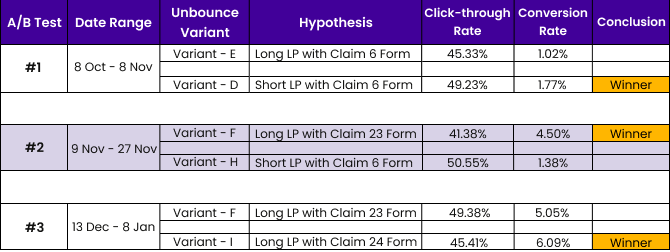
The case study gives the conversion rate at each step and says each experiment ran for around a month, but its text has no dates, traffic or claim counts; the test log and the GA4 screenshot carry the date ranges. The almost 500 percent figure is the study's own, for 1.02 to 6.09 percent.
"a very high standard"

All the work is done to a very high standard.
Five people, and a month for every experiment
The team on this project
- Team leadWaseem Bashir
- Project managerAfriyaz Maqbool
- DesignerFarzana Amin
- DeveloperTabish Mir
- GTM and GA4Samriti Chandel
A named account manager and a shared channel for the whole engagement. UK hours, which is the East Coast morning.
Three more funnels tested a step at a time


Have a page with traffic and a number that should be higher?
Send us the page and where its traffic comes from. You get a written read of what we would test first, with the reason for each hypothesis, and a monthly price. No contract, and the losses get reported too.